重新思考云原生时代的开发环境——从 Dev-to-Cloud 到 Dev@Cloud
· ☕ 7 分钟
大背景
滾滾長江東逝水,浪花淘盡英雄。

作为一个一直在底层苦苦挣扎多年程序员,保持一分学习的好奇心,对技术时势的感知,由为重要。因为这最终决定了技术方向。如果你是个在组织中有话语权的人,那么这影响到你组织的技术方向。而在技术驱动型的公司中,这个直接影响到公司的前途。
滾滾長江東逝水,浪花淘盡英雄。
作为一个一直在底层苦苦挣扎多年程序员,保持一分学习的好奇心,对技术时势的感知,由为重要。因为这最终决定了技术方向。如果你是个在组织中有话语权的人,那么这影响到你组织的技术方向。而在技术驱动型的公司中,这个直接影响到公司的前途。
还记得 15 年前,外企还是相当部分程序员的向往。而 2021 了,情况有了相当大的变化。开源界也有相当多的国人开源项目和文档了。所以很多新码农开始提出一个问题:都 2021 了,英文还是码农的基本素养吗?

图片来自:https://getboulder.com/boulder-artist-rocks-the-world/
话说,在很长一段时间,程序员依赖了摩尔定律。而在它到头之前,程序员找到了另一个救命稻草:并行/并发/最终一致。而到了今天,不是 Cloud Native / Micro Service 都不好意思打招呼了。多线程,更是 by default 的了。而在计算机性能工程界,也有一个词: Mechanical Sympathy,直译就是 机器同情心。而要“同情”的前提是,得了解。生活中,很多人了解和追求work life balance。但你的线程,是否 balance 你要不要同情一下? 一条累到要过载线程,看到其它同伴在吃下午茶,又是什么一种同情呢? 如何才能让多线程达到最大吞吐?

时间回到 2017 年,老东家要上 Kubernetes 了,有幸参与和学习(主要是学习)。当时遇到的一了所有 Java 容器化者都遇到的坑:JDK8 不为容器化设计综合症。最简单的例子是Runtime.getRuntime().availableProcessors()返回了主机的 CPU 数,而非期望的容器自身的cpu share/quota,或说 k8s 的 cpu request/limit。
如果说,引入一个技术需要兴趣和冲劲,那么,让这个技术上线需要的是坚持和执着。 Cloud Native 如是, Istio 如是。
在上线前的性能测试中,Istio 的使用提供了可观察性、运维上的便利,同时也引入了痛苦:增加了服务响应延时。如何让痛苦减到最低,成了当下之急。

话说,一年前项目响应时代的号召,引入了 Istio,从此如刘备得卧龙、凤雏,走上了 Service Mesh 的光辉大道。现到准备益州之战(上线)之时。上线前,还得评估一下性能变化。
The SysBench system benchmark suite has a simple CPU benchmark tool that calculates prime numbers. For example:
# sysbench --num-threads=8 --test=cpu --cpu-max-prime=100000 run
sysbench 0.4.12:  multi-threaded system evaluation benchmark

Running the test with following options:
Number of threads: 8

Doing CPU performance benchmark

Threads started!
Done.

Maximum prime number checked in CPU test: 100000

Test execution summary:
    total time:                          30.4125s
    total number of events:              10000
    total time taken by event execution: 243.2310
    per-request statistics:
         min:                                 24.31ms
         avg:                                 24.32ms
         max:                                 32.44ms
         approx.  95 percentile:              24.32ms

Threads fairness:
    events (avg/stddev):           1250.0000/1.22
    execution time (avg/stddev):   30.4039/0.01
This executed eight threads, with a maximum prime number of 100,000. The runtime was 30.4 s, which can be used for comparison with the results from other systems or configurations (assuming many things, such as that identical compiler options were used to build the software; see Chapter 12, Benchmarking).
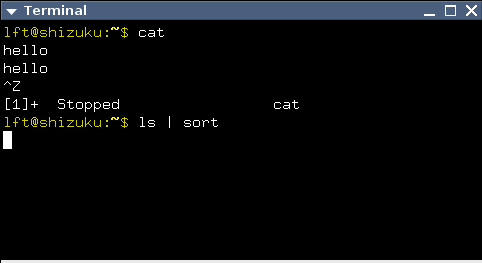
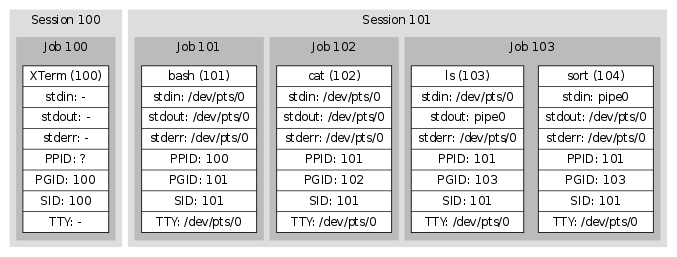
SIGHUP
当检测到 hangup 时,UART 驱动会向整个 session 发送 SIGHUP 信号。 正常情况下,这会 kill 掉所有进程。某些程序,例如 nohup(1) 和 screen(1),会从他们的 session(和 TTY)中 detach 出来, 因此这些程序的子进程无法关注到 hangup 事件。
Class loaders load classes and resources present on their respective classpath:
We can customize the default class loading behavior as well. We can explicitly specify the class loader while loading a class dynamically.
However, we should note that if we load the same class from different types of class loaders, these will be seen as different resources by the JVM.


Format is "java -Dotel.instrumentation.methods.include=my.package.MyClass1[method1,method2];my.package.MyClass2[method3]"
[arthas@16908]$ classloader -t
+-BootstrapClassLoader
+-io.opentelemetry.javaagent.bootstrap.AgentClassLoader@379619aa
+-sun.misc.Launcher$ExtClassLoader@41fa769c
  +-com.taobao.arthas.agent.ArthasClassloader@3697b340
  +-sun.misc.Launcher$AppClassLoader@18b4aac2
    +-java.net.URLClassLoader@71b2d611
    +-java.net.URLClassLoader@69cd1085
    | +-WebAppClassLoader=266661735@fe4ef67
    | | +-com.mycom.sig.foundation.servicediscovery.ExtendedClassLoader@573f7aae
    | +-WebAppClassLoader=Server Initiated@1ccb04b3
    | | +-com.mycom.sig.foundation.servicediscovery.ExtendedClassLoader@4b3b9a06
    | | +-jnr.ffi.provider.jffi.AsmClassLoader@73cb9ccb
    | | +-jnr.ffi.provider.jffi.AsmClassLoader@7c380e94
    | | +-jnr.ffi.provider.jffi.AsmClassLoader@69ec5d1f
    | +-WebAppClassLoader=OAuth Server@10d98940
    | | +-com.mycom.ece.common.svcfinder.ExtendedClassLoader@3528968e
    | | +-com.mycom.sig.foundation.servicediscovery.ExtendedClassLoader@2919aff3
    | | +-jnr.ffi.provider.jffi.AsmClassLoader@1b0e6bac
    | | +-jnr.ffi.provider.jffi.AsmClassLoader@2f12d8d1
    | | +-jnr.ffi.provider.jffi.AsmClassLoader@73123f21
    | +-WebAppClassLoader=1133988396@43974a2c
    |   +-com.mycom.sig.foundation.servicediscovery.ExtendedClassLoader@39d87c5f
    +-java.net.URLClassLoader@1b4c457c
    +-java.net.URLClassLoader@3a477cf5
Affect(row-cnt:24) cost in 31 ms.

[arthas@16908]$ classloader
 name                                                              numberOfInstances  loadedCountTotal
 org.eclipse.jetty.webapp.WebAppClassLoader                        4                  24687
 BootstrapClassLoader                                              1                  4341
 io.opentelemetry.javaagent.bootstrap.AgentClassLoader             1                  3502
 com.taobao.arthas.agent.ArthasClassloader                         1                  1430
 java.net.URLClassLoader                                           4                  1252
 sun.misc.Launcher$AppClassLoader                                  1                  570
 sun.reflect.DelegatingClassLoader                                 378                378
 sun.misc.Launcher$ExtClassLoader                                  1                  56
 jnr.ffi.provider.jffi.AsmClassLoader                              6                  8
 com.mycom.sig.foundation.servicediscovery.ExtendedClassLoader  4                  6
 com.mycom.ece.common.svcfinder.ExtendedClassLoader             1                  1
|
|
[arthas@16908]$ sc io.opentelemetry.javaagent.instrumentation.methods.MethodInstrumentationModule
io.opentelemetry.javaagent.instrumentation.methods.MethodInstrumentationModule
Affect(row-cnt:1) cost in 54 ms.
[arthas@16908]$ sc -d io.opentelemetry.javaagent.instrumentation.methods.MethodInstrumentationModule
 class-info        io.opentelemetry.javaagent.instrumentation.methods.MethodInstrumentationModule
 code-source       /
 name              io.opentelemetry.javaagent.instrumentation.methods.MethodInstrumentationModule
 isInterface       false
 isAnnotation      false
 isEnum            false
 isAnonymousClass  false
 isArray           false
 isLocalClass      false
 isMemberClass     false
 isPrimitive       false
 isSynthetic       false
 simple-name       MethodInstrumentationModule
 modifier          public
 annotation
 interfaces
 super-class       +-io.opentelemetry.javaagent.tooling.InstrumentationModule
                     +-java.lang.Object
 class-loader      +-io.opentelemetry.javaagent.bootstrap.AgentClassLoader@379619aa
 classLoaderHash   379619aa
[arthas@16908]$ sc -d io.opentelemetry.javaagent.instrumentation.methods.MethodTracer
 class-info        io.opentelemetry.javaagent.instrumentation.methods.MethodTracer
 code-source
 name              io.opentelemetry.javaagent.instrumentation.methods.MethodTracer
 isInterface       false
 isAnnotation      false
 isEnum            false
 isAnonymousClass  false
 isArray           false
 isLocalClass      false
 isMemberClass     false
 isPrimitive       false
 isSynthetic       false
 simple-name       MethodTracer
 modifier          public
 annotation
 interfaces
 super-class       +-io.opentelemetry.javaagent.shaded.instrumentation.api.tracer.BaseTracer
                     +-java.lang.Object
 class-loader      +-WebAppClassLoader=Server Initiated@1ccb04b3
                     +-java.net.URLClassLoader@69cd1085
                       +-sun.misc.Launcher$AppClassLoader@18b4aac2
                         +-sun.misc.Launcher$ExtClassLoader@41fa769c
 classLoaderHash   1ccb04b3

 class-info        io.opentelemetry.javaagent.instrumentation.methods.MethodTracer
 code-source
 name              io.opentelemetry.javaagent.instrumentation.methods.MethodTracer
 isInterface       false
 isAnnotation      false
 isEnum            false
 isAnonymousClass  false
 isArray           false
 isLocalClass      false
 isMemberClass     false
 isPrimitive       false
 isSynthetic       false
 simple-name       MethodTracer
 modifier          public
 annotation
 interfaces
 super-class       +-io.opentelemetry.javaagent.shaded.instrumentation.api.tracer.BaseTracer
                     +-java.lang.Object
 class-loader      +-WebAppClassLoader=OAuth Server@10d98940
                     +-java.net.URLClassLoader@69cd1085
                       +-sun.misc.Launcher$AppClassLoader@18b4aac2
                         +-sun.misc.Launcher$ExtClassLoader@41fa769c
 classLoaderHash   10d98940
io.opentelemetry.instrumentation.api.config.Config
->
sc -d io.opentelemetry.javaagent.shaded.instrumentation.api.config.Config

[arthas@16908]$ sc -d io.opentelemetry.javaagent.shaded.instrumentation.api.config.Config

 class-info        io.opentelemetry.javaagent.shaded.instrumentation.api.config.Config
 code-source
 name              io.opentelemetry.javaagent.shaded.instrumentation.api.config.Config
 isInterface       false
 isAnnotation      false
 isEnum            false
 isAnonymousClass  false
 isArray           false
 isLocalClass      false
 isMemberClass     false
 isPrimitive       false
 isSynthetic       false
 simple-name       Config
 modifier          abstract,public
 annotation
 interfaces
 super-class       +-java.lang.Object
 class-loader
 classLoaderHash   null