
引
本来想直接写理论、和实践分析的,但为了不 “赶客出門” 和不 TL;DR,还是以故事形式展开吧。语言要生动活泼。
故事的开始
话说,一次性能测试中,TPS 死活压不上,应用的响应时间增加。根据 Brendan Gregg 大神的最高指导精神,我开始用 USE(Utilization Saturation and Errors) 方法学去定位这个性能问题。
这时,我对系统的性能模型是这样的:
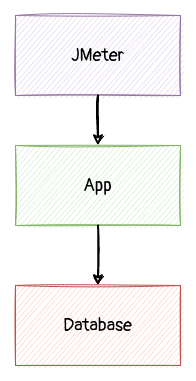
分析了相关的机器和容器,包括压力端(jmeter)、应用端、数据库端:
- Utilization - CPU、IO、网卡的 利用率均不高
- Saturation - load average 不高 、硬盘请求无排除、网卡无大量丢包。无 TCP 端口用尽等情况
- Error - 应用层,内核层均无明显报错
实战
照肺
为得知应用卡在哪儿,我使用了 java 性能分析神器:async-profiler。
大多数人在应用遇到 CPU 瓶颈时使用它来定位 CPU 热点的 java 方法,即以 CPU 时间为采集点。但它其实可能用来采集 java 方法的 时钟时间(Wall-clock) 比例的,即生成一个火焰图,java 方法的宽度反映了方法的时钟耗时比例。
ⓘ
CPU 时间(user+sys)与时钟时间(Wall-clock/elapsed real time)的区别从业近 20 年来,我发觉很多程序员没搞清楚这两个指标或概念的区别,这里 wiki 一下:
对于仅使用一个 CPU 进行处理的计算机程序,经过的实时时间总是大于或等于 CPU 时间。 如果不涉及 I/O 或其他资源的等待,则经过的实时时间和 CPU 时间非常相似。
如果程序使用并行处理,则该程序的总 CPU 时间将超过其实际运行时间。 如果工作负载均匀分布在每个 CPU 上并且不涉及 I/O 或其他资源的等待,则(总 CPU 时间)/(CPU 数量)将与实际经过的时间相同。
示例:在六核处理器上执行的软件应用程序创建三个 Unix 进程来满足用户要求。 这三个进程中的每一个都创建了两个线程,一共枚举了6个工作线程。 计算均匀分布在 6 个独立线程上。 如果不涉及等待资源,则总 CPU 时间预计为实际经过时间的六倍。
好了,黑板时间过了,回来。生成命令示例:
|
|
我的生成报告如下(经裁减):
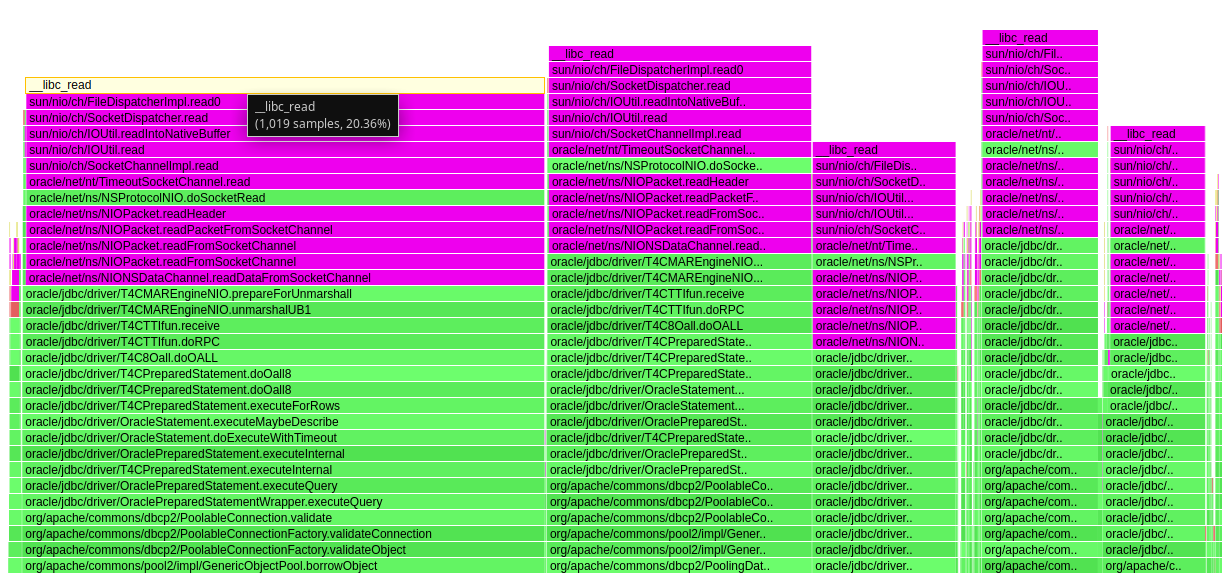
可见,应用层是在等待数据库的响应。停留在 socket write 数据库指令之后的 socket read。即应用层等待数据库的响应。
但,停留在 socket read ,一定是之前的 socket write 的数据已经发到网络吗?一定是数据库已经收到请求吗?我们看看现实的拓扑:
app-+--> socket write db query
    |     |
    |     +--> kernel socket writer buff
    |
    +--> socket read db respose
数据什么时候通过网卡发到网络由内核决定。发到网络后,什么时候才能投递到对端的网卡,由中间的路由和交换机决定。所以,这个 socket read,不一定是在等待对端,可能是等待内核,可能是路由投递。
这时,再看看对端数据库的各项指标。利用率低,无错无饱和。
那么回看之前的性能模型,在这个抽象模型下,现状是无解的。需要再挖一层。
常被忽视的网络
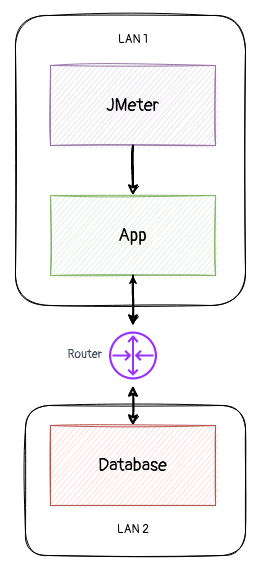
经与相关测试人员的沟通,了解了测试环境的部署模型为上图。即,应用和数据库位于不同网络,由一系列路由跳转。于是,性能模型上多了一个组件。一个对于开发不可见,也无法简单取得性能指标的组件。
怀疑的可能性有几点:
- 网络带宽不足
- 网络时延大
- 网络出于各种原因丢包(防火墙、路由优先级、MTU)
由于不能直接取得网络上路由和交换机的性能指标,眼下有几个方法作个间接测量:
这些都是很好的工具,也有很好的理论和业界经验去分析工具的输出结果。
但是,
“No man ever steps in the same river twice. For it’s not the same river and he’s not the same man.”
– Heraclitus
benchmark 永远是 benchmark。它肯定有它的参考价值,但,参考价值往往不如实际应用真实运行起来时采集到的指标!而且要费时费力部署工具,有时是跨部门协调后才能开展。
有故事的指标
这几年做性能分析和故障定位得到几条小经验是:
- 榨取问题现场的每个信息,并最大限度记录下来。
- 了解问题现场的实际部署拓扑和环境,避免一下只进入猜想和推测模式。
对于知识体系与猜想:
掌握问题点相关的领域的基础知识,建立一个基本的知识体系架构,保证后继调查少走错方向。
在了解基础知识后,了解问题的症状,然后作几个合理的怀疑和推测。
是的,猜有时是难免的,因解决问题的时间有限,但这是建立在健全的基础知识上的猜。搜索引擎和 stackoverflow.com 之类的快餐偶尔可以吃,但吃多了可能会身体虚胖。它让人可以回答和解决一些重复的入门问题,但不是每次都那么幸运。最麻烦的是,它让人觉得自己懂了,不用再花时间去系统深入地学习了。
对于指标(Metric):
找到问题相关的
指标(Metric),去证明你的猜想。找到问题相关的指标,而不是只看随手可得的指标。
对于 k8s 环境,随手可得的指标是指 cAdvisor/kubelet 提供的,已经在安装在 Gafana 仪表盘的指标。其实很多实用指标由于数据量原因、采集成本高原因,没放到默认的 cAdvisor 中。如 TCP 重传指标(cAdvisor)。
理解清楚每个相关的
指标(Metric)背后的原理和故事,比天天浏览那些现成的,漂亮的 Gafana 仪表盘重要得多。必要时,打开源码看。这看也是为什么我一直在说,如果不懂 Linux ,不要轻易说懂云原生。如果不懂 TCP,不要轻易说懂微服务问题排查。
我们先来看看有什么可能出问题的地方:
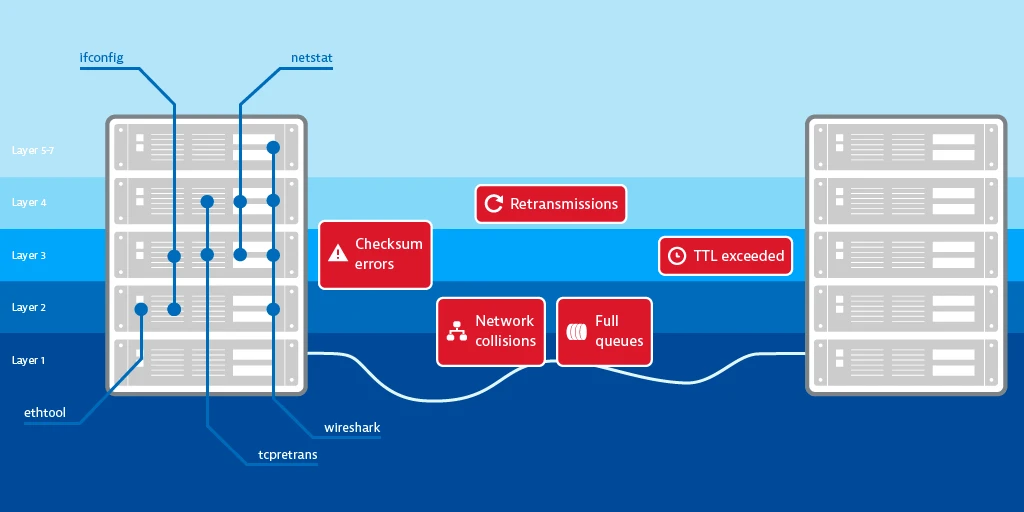
图:分配给 OSI 层的网络错误和分析工具 from Detecting network errors and their impact on services
采集 TCP 指标
扯完理论了,回到上面的现实问题。网络问题,其实会反映在 TCP 的各个指标上的。只要我们监控应用运行时的 TCP 指标,可能会看到一个未知的世界。由于我关心的指标未纳入标准的 K8s 指标集,所以 ,只能手工采集了:
|
|
输出:
#kernel
IpInReceives                    16256              0.0
IpInDelivers                    16256              0.0
IpOutRequests                   14269              0.0
TcpActiveOpens                  234                0.0
TcpPassiveOpens                 167                0.0
TcpEstabResets                  222                0.0
TcpInSegs                       16261              0.0
TcpOutSegs                      14387              0.0
TcpRetransSegs                  213                0.0
TcpOutRsts                      154                0.0
UdpInDatagrams                  10                 0.0
UdpOutDatagrams                 10                 0.0
TcpExtTW                        2                  0.0
TcpExtDelayedACKs               93                 0.0
TcpExtTCPHPHits                 4901               0.0
TcpExtTCPPureAcks               516                0.0
TcpExtTCPHPAcks                 5034               0.0
TcpExtTCPLostRetransmit         134                0.0
TcpExtTCPTimeouts               213                0.0
TcpExtTCPBacklogCoalesce        12                 0.0
TcpExtTCPAbortOnClose           151                0.0
TcpExtTCPRcvCoalesce            140                0.0
TcpExtTCPSynRetrans             213                0.0
TcpExtTCPOrigDataSent           10674              0.0
TcpExtTCPDelivered              10817              0.0
IpExtInOctets                   18794326           0.0
IpExtOutOctets                  20261697           0.0
IpExtInNoECTPkts                16264              0.0
指标简介
分析前,先简介一个主要的指标。
信息来源:
https://docs.kernel.org/networking/snmp_counter.html#:~:text=TcpExtTCPLostRetransmit
https://www.ietf.org/rfc/rfc2012.txt
基本 TCP 指标
TcpInSegs
Defined in RFC1213 tcpInSegs
The number of packets received by the TCP layer. As mentioned in RFC1213, it includes the packets received in error, such as checksum error, invalid TCP header and so on. Only one error won’t be included: if the layer 2 destination address is not the NIC’s layer 2 address. It might happen if the packet is a multicast or broadcast packet, or the NIC is in promiscuous mode. In these situations, the packets would be delivered to the TCP layer, but the TCP layer will discard these packets before increasing TcpInSegs. The TcpInSegs counter isn’t aware of GRO. So if two packets are merged by GRO, the TcpInSegs counter would only increase 1.
TcpOutSegs
Defined in RFC1213 tcpOutSegs
The number of packets sent by the TCP layer. As mentioned in RFC1213, it excludes the retransmitted packets. But it includes the SYN, ACK and RST packets. Doesn’t like TcpInSegs, the TcpOutSegs is aware of GSO, so if a packet would be split to 2 by GSO, TcpOutSegs will increase 2.
TcpActiveOpens
Defined in RFC1213 tcpActiveOpens
It means the TCP layer sends a SYN, and come into the SYN-SENT state. Every time TcpActiveOpens increases 1, TcpOutSegs should always increase 1.
TcpPassiveOpens
Defined in RFC1213 tcpPassiveOpens
It means the TCP layer receives a SYN, replies a SYN+ACK, come into the SYN-RCVD state.
TCP 重传与拥挤控制
TcpRetransSegs
重新传输的 TCP 包的总数 - 即传输的包含先前传输的八位字节的 TCP segment 的数量。
TcpExtTCPLostRetransmit
A SACK points out that a retransmission packet is lost again.
TcpExtTCPSynRetrans
The TCP stack retransmits a SYN packet.
TcpExtTCPFastRetrans
The TCP stack wants to retransmit a packet and the congestion control state is not ‘Loss’.
TCP 非正常关闭
TcpExtTCPAbortOnClose
This counter means the application has unread data in the TCP layer when the application wants to close the TCP connection. In such a situation, kernel will send a RST to the other side of the TCP connection.
TCP 连接快速建立
TcpEstabResets
The socket receives a RST packet in Establish or CloseWait state.
TCP 重传及其影响
以下引自:Detecting network errors and their impact on services
首先,重传对于确保网络中可靠的端到端通信至关重要。 重传是 TCP 协议的自愈能力正在发挥作用的一个确定信号——它们是问题的征兆,而不是问题本身。 重传的常见原因包括:
- 丢包的网络拥塞(TCP 段在到达目的地的途中丢失,或者相关的 ACK 在返回发送者的途中丢失),
- 严格的路由器 QoS 规则,
- 给予某些特定的优先处理 协议,
- 以及到达目的地乱序的 TCP 包,通常是因为在从发送方到目的地的过程中,段的顺序混淆了。
进出 Internet 的流量重传率不应超过 2%。 如果比率较高,您的服务的用户体验可能会受到影响。
因为大部分重传是基于 timeout 的,这个时间内数据流可能是卡着的。而且发生重传后,数据发送的窗口会缩小一段时间。即连接的吞吐量会下降。
TCP包重传率
https://unixadminschool.com/blog/2021/05/01/solaris-calculate-tcp-retransmission-rate-using-netstat/
%retrans = ( tcpRetransSegs / tcpOutDataSegs ) * 100
对应上面实际采集到的指标,即为:
%retrans = (TcpOutSegs / TcpRetransSegs ) * 100
计算到的重传率大约 1%~2% 。这个重传率在应用和数据库本地网间,算是高的。
其它可疑的地方
TcpExtTCPSynRetrans很高! 这意味着应用程序尝试连接到无法访问的 TCP 端口或连接数据包 (SYN) 在网络上丢弃。TcpExtTCPFastRetrans很低或不出现。TcpExtTCPSACKReorder有出现。
侏罗纪的 IP MTU & TCP MSS
这里不打算介绍什么是 MTU & MSS 了。需要了解的同学搜索一下。想深入的同学,推荐一本书:
TCP/IP Illustrated, Volume 1 Second Edition - Originally written by Dr. W. Richard Stevens.
Revised by Kevin Fall.这本书由知名网络教材作者 Dr. W. Richard Stevens 完成。我非常佩服他对复杂问题作系统和简单描述的能力!这是我大学时受益最大的书之一。
我第一次配置 MTU 这个参数,是在高中 1998 年时。当时用 36.6kbps modem 电话线拨号上网。为了让猫跑得快点。
MTU 的自动发现与调整机制
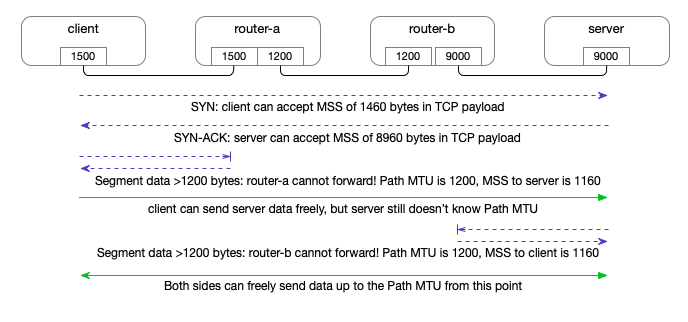
这里不说 MTU 与 TCP MSS 的基本概念,但想用一个例子,说说 MTU 的自动发现与调整机制(Path MTU Discovery/PMTUD):
参考: Ethernet MTU and TCP MSS: Why connections stall
Path MTU Discovery is the process of hosts working from the local MTU and the remote initial MSS advertisement as hints, and arriving at the actual Path MTU of the (current) full path between those hosts in each direction.
The process starts by assuming that the advertised MSS is correct for the full path, after reducing it if the local link’s MTU minus IP/TCP header size is smaller (since we couldn’t send a larger packet regardless of the MSS). When a packet is sent that is larger than the smallest link along the path, it will at least make it one hop to the first router, since we know the local link MTU is large enough to fit it.
When a router receives a packet on one interface and needs to forward it to another interface that the packet cannot fit on, the router sends back an ICMPv4 “Fragmentation required” message or an ICMPv6 “Packet Too Big” message. The router includes the MTU of the next (smaller) hop in that message, since it knows it. Upon receipt of that message, the originating host is able to reduce the calculated Path MTU for communications with that remote host, and resend the data as multiple smaller packets. From then on, packet size is correctly limited by the size of the MTU of the smallest link in the path observed so far.
A full example is below, though note that in practice there may not be complete symmetry in the path in each direction, multiple hops may progressively have smaller MTU values along the way, and the path may even change throughout the lifetime of a single connection:
This example shows how critical it is for TCP that ICMP messages of this type are forwarded correctly. This exchange is where most problems around MTU occur in production systems, when firewalls along the path block or throttle ICMP traffic in a way that inhibits Path MTU Discovery. Don’t block ICMP, it will break Path MTU Discovery and also TCP connections with large data transfers where the initial MSS advertisement is not enough to limit the Path MTU. At the very least, don’t block ICMPv4 “Fragmentation required” or ICMPv6 “Packet Too Big”, even if you block other ICMP messages.
The common
tracerouteutility observes hops between hosts using the TTL to observe each hop via TTL Exceeded messages, and this can be extended to show Path MTU (as well as the hops along the way), which is functionality that thetracepathutility provides.tracepathsends large packets, starting at the maximum sendable on the local link, to a remote host and shows any ICMP messages and the adjusted Path MTU along the way as it gradually increases TTL and decreases packet size.tracepathis a good first place to start when diagnosing issues observed between 2 hosts where MTU misconfiguration or ICMP filtering is suspected.
看完上面的英文,发觉,好像 Path MTU Discovery/PMTUD 的过程会有 TCP Segment 的重发。再参考一下:
可以说,发生数据重传,一个直观的可能是网络丢包,另一个,就是上面的 LAN1 与 LAN2 两个网络的 MTU,或中间的路由,会不会有 MTU 不适配的问题?更进一步推理,如果应用的 TCP 栈在容器的 Linux network namepace 中,对外的访问是经过一层 SNAT 的,SNAT 能正确处理或转发上图的 ICMP MTU 问题通知吗?
Pod 访问 Cluster 外部 IP 时 SNAT 的处理 ICMP 的 调查
对于使用 Calico 作为 CNI 的情况:
Calico IP pools and NAT
When a pod with an IP address in the pool initiates a network connection to an IP address to outside of Calico’s IP pools, the outgoing packets will have their source IP address changed from the pod IP address to the node IP address using SNAT (Source Network Address Translation). Any return packets on the connection automatically get this change reversed before being passed back to the pod.
Enable NAT: for pods with IP addresses that are not routable beyond the cluster
A common use case for enabling NAT outgoing, is to allow pods in an overlay network to connect to IP addresses outside of the overlay, or pods with private IP addresses to connect to public IP addresses outside the cluster/the internet (subject to network policy allowing the connection, of course). When NAT is enabled, traffic is NATed from pods in that pool to any destination outside of all other Calico IP pools.
Kubernetes 的说明:
For the traffic that goes from pod to external addresses, Kubernetes simply uses SNAT. What it does is replace the pod’s internal source IP:port with the host’s IP:port. When the return packet comes back to the host, it rewrites the pod’s IP:port as the destination and sends it back to the original pod. The whole process is transparent to the original pod, who doesn’t know the address translation at all.
再结合 NAT Behavioral Requirements for ICMP(rfc5508),看来,嵌套了问题 TCP 包源端口和源 IP地址 的 ICMP 报文,是可以正确返回到源 pod 的。
TODO
由于时间关系,今天写到这里。后面抽时间再完成吧,谢谢你花那么多时间看一编未完成的文章。