![]()
- 引
- CGroup 内存说明
- 监控与指标
- 内存限制对 IO 性能的影响
- 了解内核数据结构
- CGroup 内存回收的时机
- Page Cache 占用分析工具
- POD 的另一个杀手 驱逐 eviction
- 容器内存 kill 法大全
- 上文未提到的有用的参考
引
容器内存限制是个矛盾而重要的选择,给多了浪费资源,给少了服务随机崩溃。
CGroup 内存控制是容器资源控制的核心。她是个规律严明的看守者,在应用超限时狠心地 OOM Klll。她同时也有宽容的一面,在应用资源不足时,调配和释放 Cache 给应用使用。而其内心的记账算法却耐人寻味。要观察和监控她的状态和行为,更是千条万绪。本文尝试用作分析和梳理。
🤫 看完上面的
看守者的比喻,如果你想到身边的那位,就与我无关了。
在去年,我写了一篇:《把大象装入货柜里——Java容器内存拆解》其中简单提到了 CGroup 内存控制 和 Java 的关系。而最近在工作上又遇到到容器的内存问题,于是想比较深入和系统地去了解一下这个天坑。每个做容器化(上云)都必须面对,但最想逃避的大坑。
我们在谈容器内存时,到底在谈什么?
先列几个问题:
- 容器内存使用,只是进程用户态使用的内存?如果是,包括哪些?
- 如果包括内核态的内存,有哪些内核态内存?
- 所有内存都是强占用的吗?还是可以由内核必要时伸缩和释放?在监控到个别指标接近甚至超过上限时,一定会 OOM Kill 吗?
本文尝试分析上面问题,并发掘 CGroup 背后鲜为人知的秘技 ✨🔮 帮助精确分析 OOM Kill 问题。同时说说容器内存的估算与监控上的坑。
CGroup 内存说明
基础概念
基础概念这一节有点枯燥和 TL;DR,不喜可跳过。
Page
操作系统为提高管理内存的效率,是以 Page 为单位管理内存的,一般一个 Page 是 4kb:
以下图片和部分文字来源:https://lwn.net/Articles/443241/ 与 https://biriukov.dev/docs/page-cache/4-page-cache-eviction-and-page-reclaim/
![[System memory map]](/zh/posts/low-tec/kernel/cgroup-mem/index.assets/memcg1.png)
anonymous pages
anonymous pages,直译为 匿名页面,就是没有实际文件对应的内存 Page 了。如 应用的 Heap,Stack 空间。相反的概念就是 file pages,包括 page cache、file mapping 、tmpfs 等等。
LRU list
Linux 维护一个 LRU list 去保存 Page 的元信息,这就可以按最近访问页面的顺序去遍历页面了:
![[Active LRU]](/zh/posts/low-tec/kernel/cgroup-mem/index.assets/memcg2.png)
而为了提高回收时的效率,Linux 使用了双 LRU list:
![[Two LRUs]](/zh/posts/low-tec/kernel/cgroup-mem/index.assets/memcg3.png)
即 active LRU 与 inactive LRU。
他们的定位是:
如果内核认为在不久的将来可能不需要它们,它会将页面从active LRU移动到inactive LRU。 如果某些进程试图访问它们,则可以将inactive LRU 中的页面快速移回active LRU。 inactive LRU可以被认为是系统正在考虑很快回收的页面的一种缓刑区域。
active LRU 与 inactive LRU 的流转关系如下:
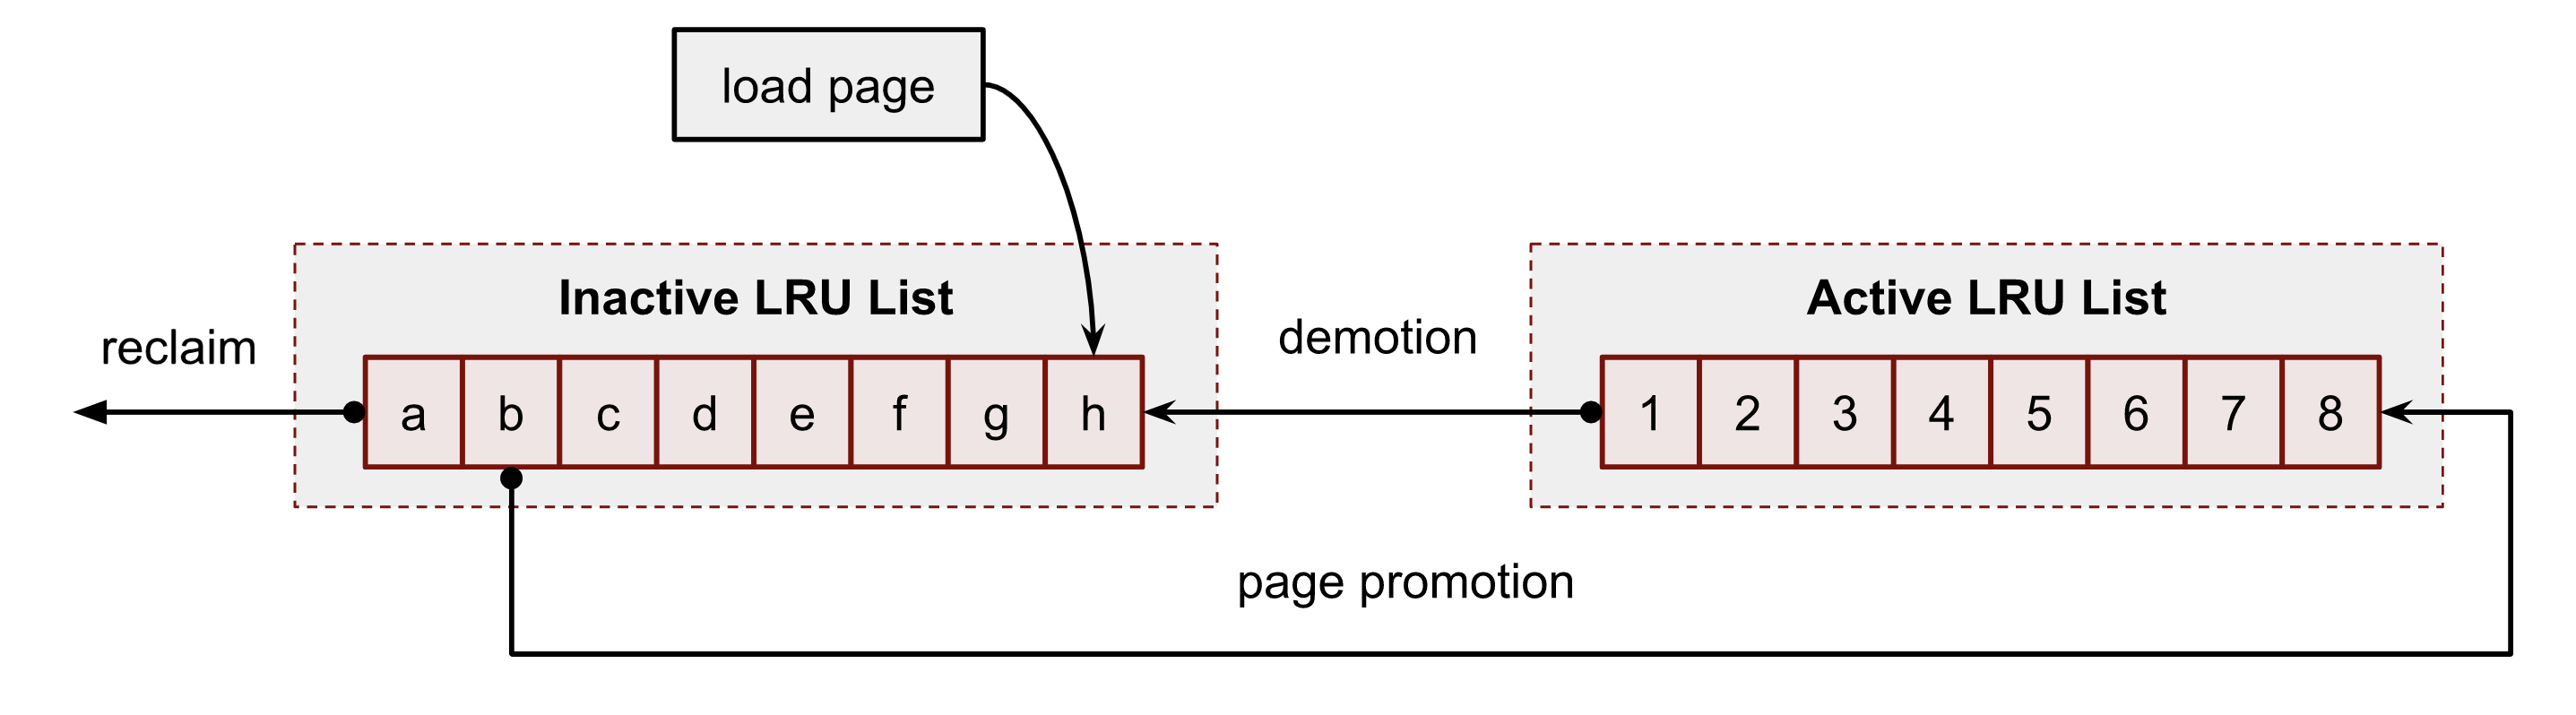
这个mm/workingset.c 源码注释作了一些解析:
Double CLOCK lists
Per node, two clock lists are maintained for file pages: the
inactiveand theactivelist. Freshly faulted pages start out atthe head of the
inactivelist and page reclaim scans pages from thetail.
Pages that are accessed multiple times on the
inactivelistare promoted to the
activelist, to protect them from reclaim,whereas
activepages are demoted to the inactive list when theactive list grows too big.
 *   fault ------------------------+
 *                                 |
 *              +--------------+   |            +-------------+
 *   reclaim <- |   inactive   | <-+-- demotion |    active   | <--+
 *              +--------------+                +-------------+    |
 *                     |                                           |
 *                     +-------------- promotion ------------------+
Access frequency and refault distance
A workload is thrashing when its pages are frequently used but they are evicted from the inactive list every time before another access would have promoted them to the active list.
In cases where the average access distance between thrashing pages is bigger than the size of memory there is nothing that can be done - the thrashing set could never fit into memory under any circumstance.
当一个工作负载的页面被频繁使用时,工作负载正在颠簸,但每次在另一个访问将它们提升到活动列表之前,它们都被从非活动列表中逐出。
在颠簸页面之间的平均访问距离大于内存大小的情况下,没有什么可以做的——在任何情况下,颠簸集都永远无法放入内存中。(译者注:大白话,就是访问的文件大小远远大于内存大小的时候)
However, the average access distance could be bigger than the inactive list, yet smaller than the size of memory. In this case, the set could fit into memory if it weren’t for the currently active pages - which may be used more, hopefully less frequently:
但是,平均访问距离可能大于
inactive list,但小于内存大小。 在这种情况下,如果不是用于当前活动的页面,该集合可能会放入内存中——这可能会被更多地使用,但希望不那么频繁:* +-memory available to cache-+ * | | * +-inactive------+-active----+ * a b | c d e f g h i | J K L M N | * +---------------+-----------+It is prohibitively expensive to accurately track access frequency of pages. But a reasonable approximation can be made to measure thrashing on the inactive list, after which refaulting pages can be activated optimistically to compete with the existing active pages.
准确跟踪页面的访问频率代价非常高。 但是可以做出一个合理的近似来测量
inactive list上的抖动,之后可以乐观地激活问题页面以与现有的active页面竞争。Approximating inactive page access frequency - Observations:
近似
非活动页面访问频率 - 观察:
When a page is accessed for the first time, it is added to the
head of the
inactive list, slides(挪动) every existinginactive pagetowards the tail by one slot(一格), and pushes the current tail page
out of memory.
When a page is accessed for the second time, it is promoted to
the active list, shrinking(收缩) the
inactive listby one slot. Thisalso slides all
inactive pagesthat were faulted into the cachemore recently than the activated page towards the tail of the
inactive list.Thus:
The sum of evictions and activations between any two points in
time indicate the minimum number of inactive pages accessed in
between.
Moving one inactive page N page slots towards the tail of the
list requires at least N inactive page accesses.
Combining these:
When a page is finally evicted from memory, the number of
inactive pages accessed while the page was in cache is at least
the number of page slots on the inactive list.
In addition, measuring the sum of evictions and activations (E)
at the time of a page’s eviction, and comparing it to another
reading (R) at the time the page faults back into memory tells
the minimum number of accesses while the page was not cached.
This is called the refault distance.
Because the first access of the page was the fault and the second
access the refault, we combine the in-cache distance with the
out-of-cache distance to get the complete minimum access distance
of this page:
NR_inactive + (R - E)
And knowing the minimum access distance of a page, we can easily
tell if the page would be able to stay in cache assuming all page
slots in the cache were available:
NR_inactive + (R - E) <= NR_inactive + NR_active
which can be further simplified to
(R - E) <= NR_active
Put into words, the refault distance (out-of-cache) can be seen as
a deficit(赤字) in
inactive listspace (in-cache). If theinactive listhad (R - E) more page slots, the page would not have been evicted
in between accesses, but activated instead. And on a full system,
the only thing eating into
inactive listspace isactive pages.Refaulting inactive pages
All that is known about the active list is that the pages have been accessed more than once in the past. This means that at any given time there is actually a good chance that pages on the active list are no longer in active use.
关于活动列表的所有已知信息是过去曾多次访问过这些页面。 这意味着在任何给定时间,活动列表中的页面实际上很有可能不再处于活动状态。
So when a refault distance of (R - E) is observed and there are at
least (R - E) active pages, the refaulting page is activated
optimistically in the hope that (R - E) active pages are actually
used less frequently than the refaulting page - or even not used at
all anymore.
That means if inactive cache is refaulting with a suitable refault
distance, we assume the cache workingset is transitioning and put
pressure on the current active list.
If this is wrong and demotion kicks in, the pages which are truly
used more frequently will be reactivated while the less frequently
used once will be evicted from memory.
But if this is right, the stale pages will be pushed out of memory
and the used pages get to stay in cache.
Refaulting active pages
If on the other hand the refaulting pages have recently been
deactivated, it means that the active list is no longer protecting
actively used cache from reclaim. The cache is NOT transitioning to
a different workingset; the existing workingset is thrashing in the
space allocated to the page cache.
Implementation
For each node’s LRU lists, a counter for inactive evictions and
activations is maintained (node->nonresident_age).
On eviction, a snapshot of this counter (along with some bits to
identify the node) is stored in the now empty page cache
slot of the evicted page. This is called a shadow entry.
On cache misses for which there are shadow entries, an eligible refault distance will immediately activate the refaulting page.
LRU list 组
当然,实现上比这还要复杂。 当前的内核实际上维护了五个 LRU 列表。
-
anonymous pages有单独的active LRU和inactive LRU- 这些页面的回收策略是不同的,如果系统在没有交换分区(swap)的情况下运行,它们不会被回收(这是一般 Kubernetes 的情况了,尽管新版本有出入)。 -
不可回收的页面列表(
LRU_UNEVICTABLE) , 例如,已锁定到内存中的页面。 -
文件相关的列表
5 个列表的源码见:
|
|
在未有 CGroup 之前,每个 NUMA Node + Zone 内存区域 都存在一组这些列表,被称为“全局 LRU”:
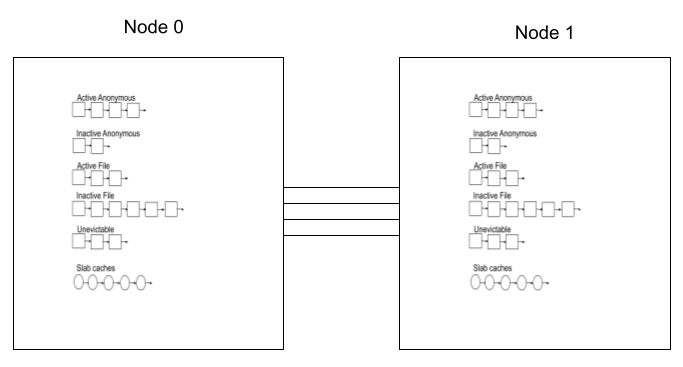
图:NUMA 下的 LRU,图片来源
有了 cgroup mem controller 后,因为要控制和跟踪每个 cgroup 的内存使用,增加了另一个级别的复杂性。cgroup mem controller 需要跟踪每个页面的更多信息,将每个页面与所属的cgroup mem controller相关联。 将该信息添加到 struct page 页面元信息 中。
有了 cgroup mem controller 后,LRU 列表处于每个 cgroup 和 每个 NUMA node 一组的级别。 每个内存 cgroup 都有自己的内存回收器专用 LRU 列表:
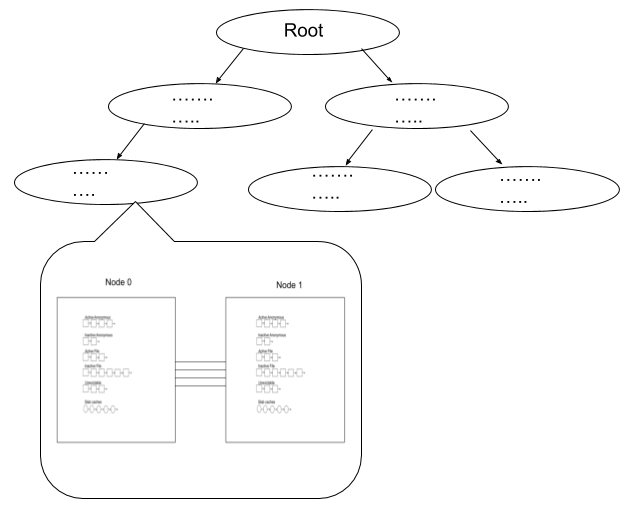
图:CGroup + NUMA 下的 LRU,图片来源
CGroup 概述
Linux 的 kernel.org 官方文档:
这个文档的读者对象是内核开发者或研究者,对新人不太好入门。如果硬翻译写在这里,就是赶客出门了。不过一些核心信息还得说说。
主记账范围
主记账内存的上限配置在文件 memory.limit_in_bytes 中,对应 k8s 中的 spec.containers[].resources.limits.memory
CGROUP 主要记账以下部分:
anon pages (RSS),文件不相关的内存,如 heapcache pages (Page Cache), 文件相关的内存,如 File Cache/File Mapping。
对于可回收的内存(如文件的 Cache 或 File Mapping),CGROUP 通过 LRU 链表记录 Page 的访问顺序。按 FIFO(LRU) 方法回收。
对于初学 Linux 的同学,有一点需要强调的是,内存记账是以实际访问的 Page 为准的,不是分配的 Page。说白了,就是只对有访问过的页才记账。
如果你是 Java 程序员,这就是 -Xms xG -Xmx xG 之外 还要-XX:+AlwaysPreTouch 原因之一。尽早记账和发现问题。
内核内存记账范围
内核空间的内存也可以记账,也可以配置上限。不过 k8s 暂时好像不支持这个 cgroup 限制。需要注意的是,cache pages 算入主记账范围,不算入内核内存记账范围。
内核内存上限配置在文件 memory.kmem.limit_in_bytes 中。它主要包括:
- stack pages
- slab pages
- sockets memory pressure
- tcp memory pressure
内存回收
Memory Resource Controller from kernel.org
Each cgroup maintains a per cgroup LRU which has the same structure as global VM. When a cgroup goes over its limit, we first try to reclaim memory from the cgroup so as to make space for the new pages that the cgroup has touched. If the reclaim is unsuccessful, an OOM routine is invoked to select and kill the bulkiest task in the cgroup. (See 10. OOM Control below.)
The reclaim algorithm has not been modified for cgroups, except that pages that are selected for reclaiming come from the per-cgroup LRU list.
每个 cgroup 维护一个
cgroup LRU 组,其结构与全局 LRU 组相同。 当一个 cgroup 访问的内存 超过它的限制时,我们首先尝试从 cgroup 中回收内存,以便为新内存页腾出空间。 如果回收不成功,则会调用 OOM 流程来选择并终止 cgroup 中最庞大的任务。cgroups 的回收算法和之前的
全局 LRU一样的,除了被选择用于回收的页面来自per-cgroup LRU列表。其实主要可以回收的,就是 Page Cache 了。
状态文件
文件比较多,这里只说几个重要的。
memory.stat
memory.stat 文件包括一些统计信息:
| metrics | mean |
|---|---|
| cache | # of bytes of page cache memory. |
| rss | # of bytes of anonymous and swap cache memory (includes transparent hugepages). |
| rss_huge | # of bytes of anonymous transparent hugepages. |
| mapped_file | # of bytes of mapped file (includes tmpfs/shmem) |
| pgpgin | # of charging events to the memory cgroup. The charging event happens each time a page is accounted as either mapped anon page(RSS) or cache page(Page Cache) to the cgroup. |
| pgpgout | # of uncharging events to the memory cgroup. The uncharging event happens each time a page is unaccounted from the cgroup. |
| swap | # of bytes of swap usage |
| dirty | # of bytes that are waiting to get written back to the disk. |
| writeback | # of bytes of file/anon cache that are queued for syncing to disk. |
| inactive_anon | # of bytes of anonymous and swap cache memory on inactive LRU list. |
| active_anon | # of bytes of anonymous and swap cache memory on active LRU list. |
| inactive_file | # of bytes of file-backed memory on inactive LRU list. |
| active_file | # of bytes of file-backed memory on active LRU list. |
| unevictable | # of bytes of memory that cannot be reclaimed (mlocked etc). |
注:表中的 # 是 number,即数量的意思。
注意:只有 anonymous 和 swap cache memory 被纳入为“rss”统计的一部分。 这不应与真正的“resident set size 常驻内存大小” 或 cgroup 使用的物理内存量相混淆。
“rss + mapped_file” 可以认为是 cgroup 的 resident set size 常驻内存大小。
(注意:file 相关的内存页 和 shmem 可以和其他 cgroup 共享。在这种情况下,mapped_file 只包括 page cache 的所有者为本 cgroup 的 page cache。第一个访问这个页的 cgroup 即为所有者 )
memory.usage_in_bytes
这相当于 memory.stat 中的 RSS+CACHE(+SWAP) 。不过有一定更新延迟。
memory.numa_stat
提供 cgroup 中的 numa node 内存分配信息。如之前的图所说,每个 NUMA node 有自己的 LRU list 组。
memory.failcnt
cgroup 提供 memory.failcnt 文件。 显示达到 CGroup 限制的次数。 当内存 cgroup 达到限制时,failcnt 会增加,触发回收内存。
控制与事件通知
文件比较多,这里只说几个重要的。
强制回收内存 memory.force_empty
|
|
回收所有可以回收的内存,K8s 禁用 Swap 情况下,主要是 文件相关的 Page Cache 了。
这里有一件有趣的事。
memory.force_emptyinterface is provided to make cgroup’s memory usage empty.
You can use this interface only when the cgroup has no tasks.
When writing anything to this
memory.force_emptyinterface is provided to make cgroup’s memory usage empty.
When writing anything to this
即 kernel v4.0 后,没说需要 cgroup 一定要没进程下,才能强制回收。这个小插曲是发生在我推荐这功能给一个同学使用时,同学找到了一份 旧 Redhat 6.0 文档说不能在有进程的情况下强制回收。
基于内存阈值水位的通知
CGroup 有一个神秘隐藏秘技,k8s 好像没使用,就是可以设置内存使用的多个水位的通知。其中使用了文件 cgroup.event_control 这里不细说,有兴趣的同学移步:
https://www.kernel.org/doc/html/v5.4/admin-guide/cgroup-v1/memory.html#memory-thresholds
这个隐藏秘技有什么用?想想,如果我们要定位一个容器的 OOM 问题,在快要到 limit 和 OOM 前,core dump 或 java heap dump 一下,是不是就可以分析一下进程当时的内存使用情况?
不要 OOM Kill,只是暂停
这个,也是 CGroup 的神秘隐藏秘技,k8s 好像没使用。这个隐藏秘技有什么用?想想,如果我们要定位一个容器的 OOM 问题,在将要发生 OOM 时,容器暂停了。这时,我们可以:
- core dump 进程
- 或 配置更大的 CGroup 上限,让 jvm 继续跑,然后,java heap dump
是不是就可以分析一下进程当时的内存使用情况?
有兴趣移步:
https://www.kernel.org/doc/html/v5.4/admin-guide/cgroup-v1/memory.html#oom-control
相关文件:memory.oom_control
监控与指标
有实际运维经验的同学都知道,运维最难的是监控,监控最难的是选择和理解指标,还有指标间千丝万缕的关系。
K8s 的容器指标
K8s 自带容器指标数据源是来自 kubelet 中运行的 cAdvisor 模块 的。
而 cAdvisor 的官方 Metric 说明文档在这:Monitoring cAdvisor with Prometheus 。这个官方文档是写得太简单了,简单到不太适合问题定位……
好在,高手在民间:Out-of-memory (OOM) in Kubernetes – Part 3: Memory metrics sources and tools to collect them:
| cAdvisor metric | Source OS metric(s) | Explanation of source OS metric(s) | What does the metric mean? |
|---|---|---|---|
container_memory_cache |
total_cache value in the memory.stat file inside the container’s cgroup directory folder |
number of bytes of page cache memory | Size of memory used by the cache that’s automatically populated when reading/writing files |
container_memory_rss |
total_rss value in the memory.stat file inside the container’s cgroup directory folder |
number of bytes of anonymous and swap cache memory (includes transparent hugepages). […]This should not be confused with the true ‘resident set size’ or the amount of physical memory used by the cgroup. ‘rss + mapped_file’ will give you resident set size of cgroup” | Size of memory not used for mapping files from the disk |
container_memory_mapped_file |
total_mapped_file value in the memory.stat file inside the container’s cgroup directory folder |
number of bytes of mapped file (includes tmpfs/shmem) | Size of memory that’s used for mapping files |
container_memory_swap |
total_swap value in the memory.stat file inside the container’s cgroup directory folder |
number of bytes of swap usage | |
container_memory_failcnt |
The value inside the memory.failcnt file |
shows the number of times that a usage counter hit its limit | |
container_memory_usage_bytes |
The value inside the memory.usage_in_bytes file |
doesn’t show ‘exact’ value of memory (and swap) usage, it’s a fuzz value for efficient access. (Of course, when necessary, it’s synchronized.) If you want to know more exact memory usage, you should use RSS+CACHE(+SWAP) value in memory.stat | Size of overall memory used, regardless if it’s for mapping from disk or just allocating |
container_memory_max_usage_bytes |
The value inside the memory.max_usage_in_bytes file |
max memory usage recorded | |
container_memory_working_set_bytes |
Deduct inactive_file inside the **memory.stat **file from the value inside the memory.usage_in_bytes file. If result is negative then use 0 |
inactive_file: number of bytes of file-backed memory on inactive LRU list usage_in_bytes: doesn’t show ‘exact’ value of memory (and swap) usage, it’s a fuzz value for efficient access. (Of course, when necessary, it’s synchronized.) If you want to know more exact memory usage, you should use RSS+CACHE(+SWAP) value in memory.stat |
A heuristic for the minimum size of memory required for the app to work. the amount of memory in-use that cannot be freed under memory pressure[…] It includes all anonymous (non-file-backed) memory since Kubernetes does not support swap. The metric typically also includes some cached (file-backed) memory, because the host OS cannot always reclaim such pages. See the cAdvisor table for the formula containing base OS metrics |
表:CAdvisor 的指标和来源
如果上面的描述还不足以满足你的好奇心,那么这里有更多:
常被误解的 K8s 指标
container_memory_usage_bytes
A Deep Dive into Kubernetes Metrics — Part 3 Container Resource Metrics
You might think that memory utilization is easily tracked with
container_memory_usage_bytes, however, this metric also includes cached (think filesystem cache) items that can be evicted under memory pressure. The better metric iscontainer_memory_working_set_bytesas this is what the OOM killer is watching for.
container_memory_working_set_bytes
Memory usage discrepancy: cgroup memory.usage_in_bytes vs. RSS inside docker container
container_memory_working_set_bytes=container_memory_usage_bytes-total_inactive_file(from /sys/fs/cgroup/memory/memory.stat), this is calculated in cAdvisor and is <=container_memory_usage_bytes
kubectl top
Memory usage discrepancy: cgroup memory.usage_in_bytes vs. RSS inside docker container
when you use the
kubectl top podscommand, you get the value ofcontainer_memory_working_set_bytesnotcontainer_memory_usage_bytesmetric.
container_memory_cache 与 container_memory_mapped_file 的关系
Out-of-memory (OOM) in Kubernetes – Part 3: Memory metrics sources and tools to collect them:
Notice the “page cache” term on the definition of the
container_memory_cachemetric. In Linux the page cache is “used to cache the content of files as IO is performed upon them” as per the “Linux Kernel Programming” book by Kaiwan N Billimoria(本文作者注:这本书我看过,是我看到的,最近最好解理的内核图书). You might be tempted as such to think thatcontainer_memory_mapped_filepretty much refers to the same thing, but that’s actually just a subset: e.g. a file can be mapped in memory (whole or parts of it) or it can be read in blocks, but the page cache will include data coming from either way of accessing that file. See https://stackoverflow.com/questions/258091/when-should-i-use-mmap-for-file-access for more info.
什么 metric 才是 OOM Kill 相关
Memory usage discrepancy: cgroup memory.usage_in_bytes vs. RSS inside docker container
It is also worth to mention that when the value of
container_memory_usage_bytesreaches to the limits, your pod will NOT get oom-killed. BUT ifcontainer_memory_working_set_bytesorcontainer_memory_rssreached to the limits, the pod will be killed.
内存限制对 IO 性能的影响
Page cache usage by apps is counted towards a cgroup’s memory limit, and anonymous memory usage can steal page cache for the same cgroup
应用程序的页面缓存使用量计入 cgroup 的内存限制,
anonymous memory 匿名内存使用可以窃取同一 cgroup 的页面缓存
这句话就是说,容器内存紧张时,文件缓存会减少,重复读的性能会下降。写入(Writeback) 的性能也可能会下降。所以如果你的容器有比较多 文件 IO,请谨慎配置内存 limit。
了解内核数据结构
下面是最近画的一张相关的内核数据结构图草稿。只作个参考,还有很多关系和细节未理清……

CGroup 内存回收的时机
是不是只在超过 limit 时申请内存,才启动回收(即 direct reclaim)?还是有 background reclaim ?
以下只是个社区的建议方案邮件:
memcg: per cgroup background reclaim on 13 Apr 2011
The current implementation of memcg supports targeting reclaim when the
cgroup is reaching its hard_limit and we dodirect reclaimper cgroup.Per cgroup background reclaim is needed which helps to spread out memory
pressure over longer period of time and smoothes out the cgroup performance.
阿里云自己实现了。阿里云好像大量作了 CGroup 的修改:
在社区内核系统中,系统分配内存并在相应memcg中的统计达到memcg设定的内存上限时,会触发memcg级别的直接内存回收。直接内存回收是发生在内存分配上下文的同步回收,因此会影响当前进程的性能。
为了解决这个问题,Alibaba Cloud Linux 2增加了memcg粒度的后台异步回收功能。该功能的实现不同于全局kswapd内核线程的实现,并没有创建对应的memcg kswapd内核线程,而是采用了workqueue机制来实现,并在cgroup v1和cgroup v2两个接口中,均新增了4个memcg控制接口。
但这个说是有 background reclaim :
Understanding Linux swap behavior on Apr 21, 2019
kswapd is triggered per cgroup level based on different memory pressure when memory use is close to hard limit for that cgroup (or close to full capacity if no hard limit is set)
一些参考:
Page Cache 占用分析工具
找到占用 Page Cache 的文件:
另一种 OOM 杀手 Worrker Node OOM eviction(驱逐) pod
本节内容多数来自:Out-of-memory (OOM) in Kubernetes – Part 4: Pod evictions, OOM scenarios and flows leading to them
Out-of-memory (OOM) in Kubernetes – Part 4: Pod evictions, OOM scenarios and flows leading to them
But when does the Kubelet decide to evict pods? “Low memory situation” is a rather fuzzy concept: we’ve seen that the OOM killer acts at the system level (in OOM killer) when memory is critically low (essentially almost nothing left), so it follows that pod evictions should happen before that. But when exactly?
As per the official Kubernetes docs “‘Allocatable’ on a Kubernetes node is defined as the amount of compute resources that are available for pods“. This feature is enabled by default via the
--enforce-node-allocatable=podsand once the memory usage for the pods crosses this value, the Kubelet triggers the eviction mechanism: “Enforcement is performed by evicting pods whenever the overall usage across all pods exceeds ‘Allocatable’” as documented here.We can easily see the value by checking the output of
kubectl describe node. Here’s how the section of interest looks like for one of nodes of the Kubernetes cluster used throughout this article (a 7-GiB Azure DS2_v2 node):
Pods 在 Node 中的可用内存:
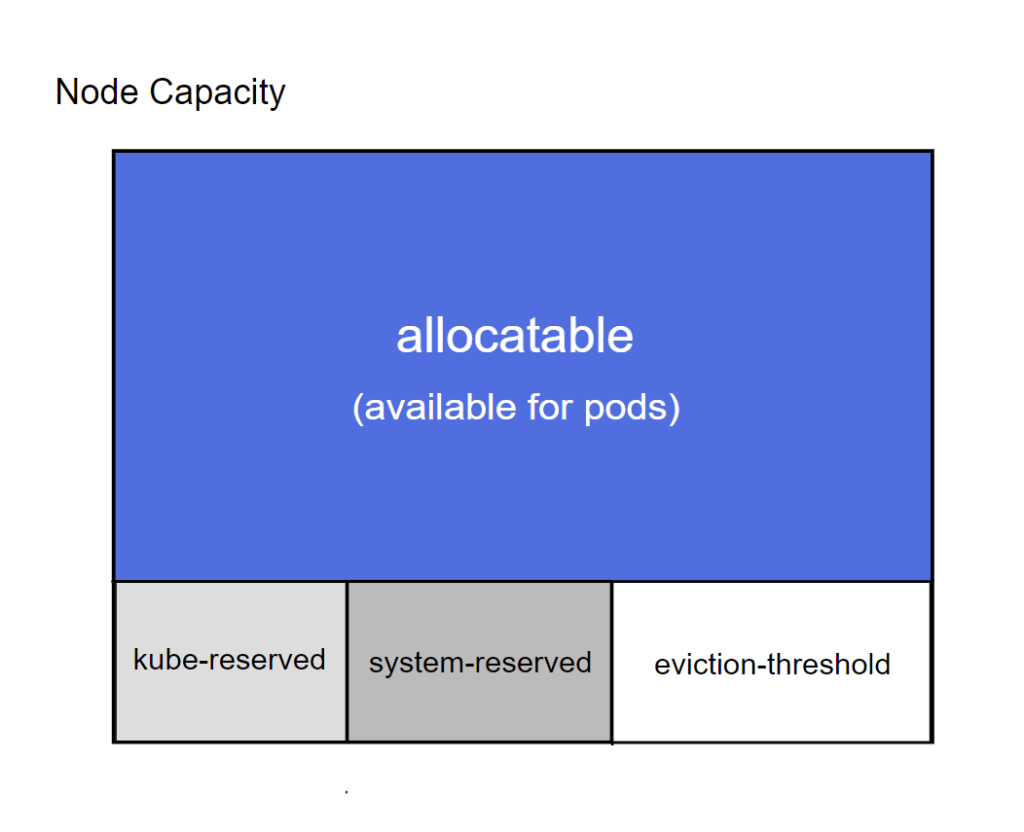
图:Worker node 内存分类, 来源
--kube-reservedThe flag is described in the official docs https://kubernetes.io/docs/tasks/administer-cluster/reserve-compute-resources/#kube-reserved as “kube-reserved is meant to capture resource reservation for kubernetes system daemons like the
kubelet,container runtime,node problem detector, etc. It is not meant to reserve resources for system daemons that are run as pods. kube-reserved is typically a function of pod density on the nodes“
--system-reserved
system-reservedis meant to capture resource reservation for OS system daemons likesshd,udev, etc.system-reserved should reserve memory for the kernel too since kernel memory is not accounted to pods in Kubernetes at this time. Reserving resources for user login sessions is also recommended (user.slice in systemd world).
--eviction-hardMemory pressure at the node level leads to System OOMs which affects the entire node and all pods running on it. Nodes can go offline temporarily until memory has been reclaimed. To avoid (or reduce the probability of) system OOMs kubelet provides out of resource management. Evictions are supported for
memoryandephemeral-storageonly. By reserving some memory via--eviction-hardflag, thekubeletattempts to evict pods whenever memory availability on the node drops below the reserved value.
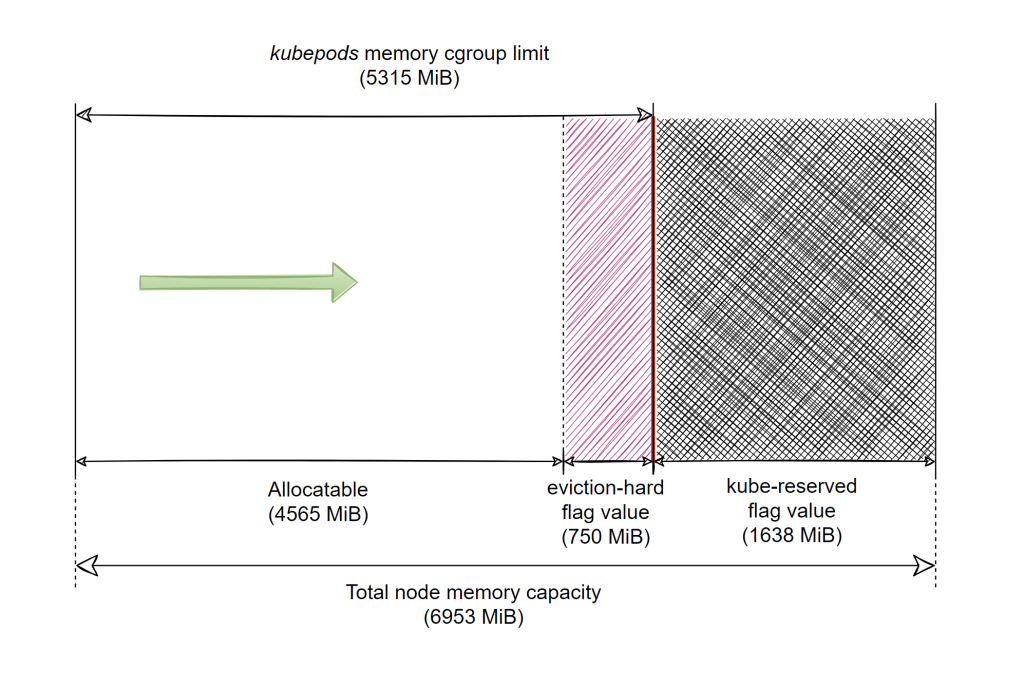
图:Worker node 可分配内存容量分布
如何查看 worker node 所有 pod 可使用内存(上图的 Allocateable + eviction-hard )的总和,即不发生 cgroup OOM killer 的阀值:
|
|
驱逐 eviction 算法参考指标
We’re talking about memory usage a lot, but what exactly do we mean by that? Take the “allocatable” amount of memory that pods can use overall: for our DS2_v2 AKS nodes that is 4565 MiB. Is it when the RAM of a node has 4565 MiB filled with data for the pods means it’s right next to the threshold of starting evictions? In other words, what’s the metric used?
Back in the Metrics values section we’ve seen there are quite a few metrics that track memory usage per type of object. Take the container object, for which cAdvisor will return half a dozen metrics such as
container_memory_rss,container_memory_usage_bytes,container_memory_working_set_bytesetc.So when the Kubelet looks at the eviction thresholds, what memory metric is it actually comparing against? The official Kubernetes documentation provides the answer to this: it’s the
working set. There’s even a small script included there that shows the computations for deciding evictions at the node level. Essentially it computes theworking_setmetric for the node as the root memory cgroup’smemory.usage_in_bytesminus theinactive_filefield in the root memory cgroup’smemory.statfile.Kubernetes 计算 eviction 阀值的方法:用
working_set,working_set的计算方法就是 :
working_set=kube 的根 cgroup 的 memory.usage_in_bytes-memory.stat 的 inactive_file 字段And that is the exact formula we’ve come across in the past when we’ve looked at how are the node metrics computed through the Resource Metrics API (see the last row of the cAdvisor metrics table). Which is good news, as we’ll be able to plot the same exact metrics used in Kubelet’s eviction decisions on our charts in the following sections, by choosing the metric source which currently gives almost all of the memory metrics: cAdvisor.
As a side-note, if you want to see that the Kubelet’s code reflects what was said above – both for the “allocatable” threshold as well as the
--eviction-hardone – have a look at What is the memory metric that the Kubelet is using when making eviction decisions?.https://kubernetes.io/docs/concepts/scheduling-eviction/node-pressure-eviction/ :
active_file memory is not considered as available memory
On Linux, the kernel tracks the number of bytes of file-backed memory on active LRU list as the
active_filestatistic. The kubelet treatsactive_filememory areas as not reclaimable. For workloads that make intensive use of block-backed local storage, including ephemeral local storage, kernel-level caches of file and block data means that many recently accessed cache pages are likely to be counted asactive_file. If enough of these kernel block buffers are on the active LRU list, the kubelet is liable(容易) to observe this as high resource use and taint the node as experiencing memory pressure - triggering pod eviction.For more more details, see https://github.com/kubernetes/kubernetes/issues/43916
You can work around that behavior by setting the memory limit and memory request the same for containers likely to perform intensive I/O activity. You will need to estimate or measure an optimal memory limit value for that container.
如果是 IO 读写型的应用。可能由于重复读写比较多的
page cache而使用大量的active_file,进而 working_set 会很大。这类型应用很容易被 kubernetes 认为是过量占用内存。对于这种类型的应用,建议配置 memrory limit = memory request 。
触发驱逐 eviction 的场景
Pods’ memory usage exceeds node’s “allocatable” value
即 pods 使用的总内存超过 Allocatable 时。
Node available memory drops below the --eviction-hard flag value
即 worker node 的由于其它非 pod 进程使用了内存,导致可用内存小于 eviction-hard 阀值,这时会触发 eviction。
例如,假设操作系统开始消耗更多内存。尽管 Kubelet 设置了 pod 总体上可以使用多少内存的限制,但它并不能保留该内存。默认情况下,没有什么可以阻止操作系统——或运行在它之上的其他进程——开始侵占 Kubernetes“ Allocatable ”领域。当这种情况发生时,pod 将被更早地驱逐:尽管整体 pod 内存使用率低于“ Allocatable”值,但还有另一个阈值被击中:eviction threshold。
驱逐 eviction 的选 pod 机制
How does all we’ve seen in the previous section reflect in the eviction mechanism? Pods are allowed to use memory as long as the overall usage across all pods is less than the allocatable memory value. Once this threshold is exceeded, you’re at the mercy of the Kubelet(你任由 Kubelet 摆布) – as every
10sit checks the memory usage against the defined thresholds. Should the Kubelet decide an eviction is necessary the pods are sorted based on an internal algorithm described in Pod selection for kubelet eviction – which includes QoS class and individual memory usage as factors – and evicts the first one. The Kubelet continues evicting pods as long as thresholds are still being breached. Should one or more pods allocate memory so rapidly that the Kubelet doesn’t get a chance to spot it inside its 10s window, and the overall pod memory usage attempts to grow over the sum of allocatable memory plus the hard eviction threshold value, then the kernel’s OOM killer will step in and kill one or more processes inside the pods’ containers, as we’ve seen at length in the Cgroups and the OOM killer section.
说了那么多,可以 Get 到一点比较简单直接的是, POD 的 memory 实际使用超过 memory request 越多,越有可能被选中 驱逐 eviction。
什么时候发生 eviction ? 就是使用内存(working_set)超过了 Allocatable 内存时。
Eviction 的一些总结
OOM killer 与 pod 驱逐的范围:OOM killer最多在容器级别起作用,终止这些容器内的进程(主进程可以是第一个,也可以不是)。另一方面,Pod 驱逐将针对整个 Pod 及其所有容器。
驱逐过程涉及 3 个标志:
--kube-reserved标志值保护 Kubelet 和其他 Kubernetes 守护进程免受 pod 分配过多内存的影响。它通过规定“kubepods”内存 cgroup 的限制来实现这一点,该 cgroup 是所有 pod 及其容器的父级。因此,如果 pod 尝试占用超过capacity---kube-reserved,那么 OOM killer 就会介入,选择并杀死这些容器内的一个进程。这保证了 pod 永远不会“侵占”--kube-reserved值的保留内存。- 如果 pods 分配的容量小于
capacity---kube-reserved,但大于 kubectl describe 节点输出中的“Allocatable”——那么 Kubelet 将选择并驱逐一个 pod(前提是它及时“捕获”它,因为它仅每 10 秒检查一次驱逐阈值)。请注意,操作系统、其他非 Kubernetes 容器运行的守护进程或进程不会被此标志停止,这仅仅是因为--kube-reserved转换为如上所示的设置,只有 pod 受到影响,而不是“常规”操作系统进程。--eviction-hard标志确保一旦节点低于指定内存量 pod 开始被逐出,同时它还间接指示 pod 的“可分配”内存的大小。--system-reserved标志可供使用,但 AKS 目前默认不为其设置值。
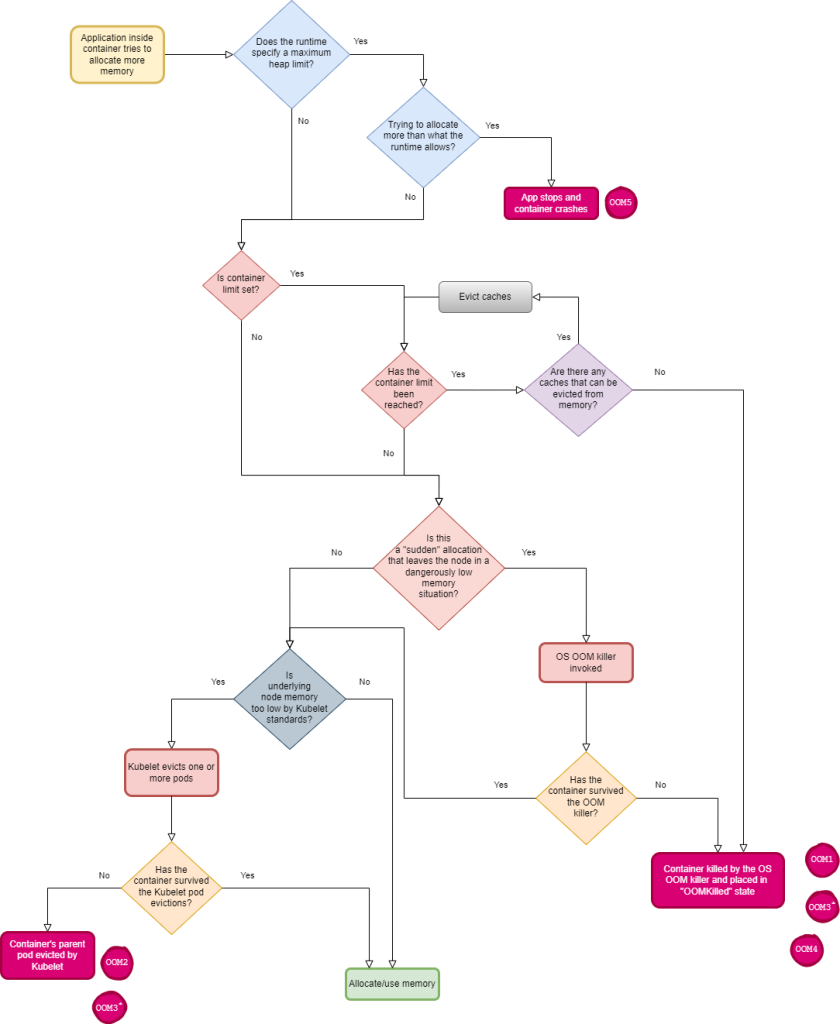
容器内存 kill 法大全
这里有个容器内存事件处理逻辑图。一句话,玩火要小心,不然,总有一种 kill 法适合你。
from Out-of-memory (OOM) in Kubernetes – Part 4: Pod evictions, OOM scenarios and flows leading to them
上文未提到的有用的参考
- Out-of-memory (OOM) in Kubernetes – Part 1: Intro and topics discussed
- SRE deep dive into Linux Page Cache
- Dropping cache didn’t drop cache
- Memory Measurements Complexities and Considerations - Part 1
- Overcoming challenges with Linux cgroups memory accounting
附录
Signal 与 exit code
When a container terminates – regardless if it ran to completion or something bad happened to it – Kubernetes will make a note of its exit code. You can easily see it in the output of kubectl describe pod for its parent pod. That exit code provides valuable information about what happened to the main process inside that container.
There are great articles that talk about the possible ranges of exit codes and Kubernetes, such as Exit Codes in Containers and Kubernetes – The Complete Guide. So what we’re going to talk about next is mostly related to our focus on out-of-memory situations.
The topic of signals and exit codes on Linux is rather complex, with differences between the various shells used and various other subtleties. If you want the full picture you can start from this StackExchange thread. But to simplify, the main idea is that if the exit code is larger or equal to 128 then it means our container was killed by a signal it received. Deducting 128 from the exit code will identify the signal number that was sent. Based on this number we can find the corresponding signal, e.g. by consulting the list on the signal man page here.
Leaving aside soft-eviction thresholds – which AKS at least doesn’t make use of currently – whether the Kubelet decides to evict a container’s parent pod or the OOM killer terminates the main process for that container doesn’t matter in terms of exit code reported by Kubernetes. It will be 137, as SIGKILL is sent for both cases of pod evictions and OOM killer.
If a container is OOM killed, then kubectl describe pod ran against the parent pod will list “OOMKilled” in the “reason” field. How does the Kubelet know how to stamp the container with OOMKilled when it does get terminated by the OOM killer? Because the Kubelet watches for events generated by the kernel when the OOM killer acts, so it knows what happened and to whom (refer back to Is Kubelet killing containers due to OOM?).
There’s another exit code we care about: in case of our memory leak tool, if it tries to allocate more memory than what the .NET runtime allows – a situation we’ve analyzed in detail back in Runtime implications around OOM – then the process is terminated with exit code 139. This corresponds to the SIGSEGV signal, emitted for an invalid memory access.