Why tuning
If it takes interest and momentum to push a new technology, then what is needed to get this technology go to live production is hard working. Including Cloud Native and Istio.
In pre-launch performance testing, Istio out-of-box provided observability, operational convenience, and also introduced pain: Increased service latency. How to minimize latency has become a critical task.
My Scenario:
- SERVICE-A invoke SERVICE-B
- Latency of Service-A, which was previously 9ms at P50, is now 14ms at P50.
Bottleneck Analysis
There are two paths under my feet:
- Directly adjust some configurations that are considered suspicious and disable some functions. Then stress test to see the results.
- Do a CPU profile on the sidecar to locate suspicious places. Let tuning make sense.
I chose the second one.
Profile Sidecar CPU
As a mature open source product, Istio has official benchmark project:
https://github.com/istio/tools/tree/release-1.8/perf/benchmark
What make me interesting: https://github.com/istio/tools/tree/release-1.8/perf/benchmark/flame#setup-perf-tool-envoy 。
perf installation
Run the linux perf tool in the container to profile the sidecar. There are some difficulties, such as the Istio-proxy container default full file system read-only, which I modified to be writable. You need to enter the container as root. If you feel troublesome, you can also make a custom image based on the original image. The method is not the focus of this article and will not be discussed. You can then install perf with a package tool such as apt.
Here is an example of an istio-proxy container configuration:
|
|
Run profile, Generate Flame Graph
Enter the istio-proxy container as root (yes, root save your time avoiding permission problem).
|
|
After copying perf.stacks file to your PC, generate the Flame Graph. Yes, a perl script is required: https://github.com/brendangregg/FlameGraph (produced by my idol Brendan Gregg)
|
|
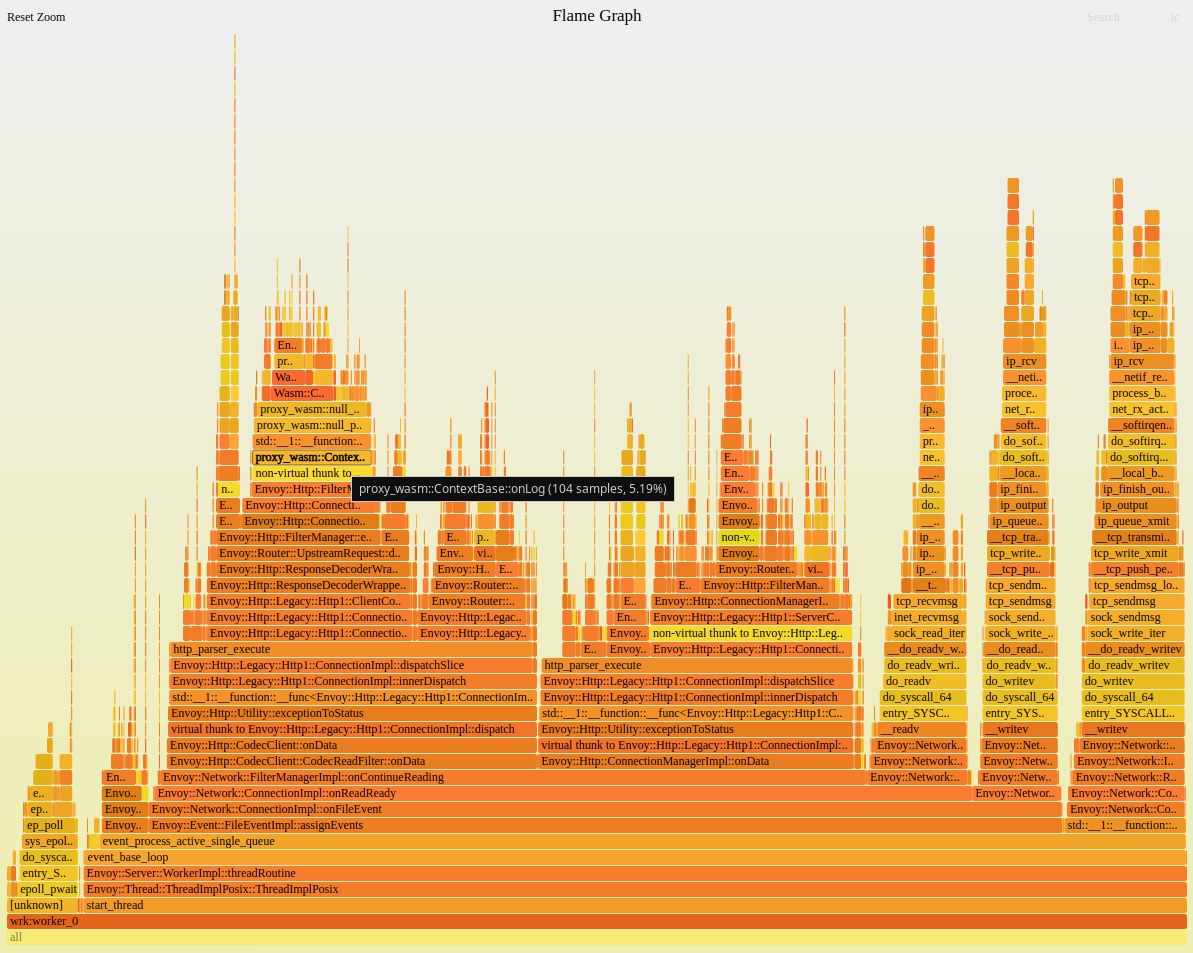
And perf.svg has been generated:
The above figure is just an Envoy worker thread, and there is a thread similar to it. So the proxy_wasm::ContextBase::onLog above uses 14% of the cpu of the whole process. As you can see from the image above, this is probably an Envoy extension Filter. The question is, what is this Filter and why some stack symbol couldn’t be resolved (perf-18.map in the figure above).
Envoy Filter - WASM utopia
What I do know is that WASM is a VM engine (let’s take the analogy of JVM). Envoy supports both:
- native extensions
- WASM extensions.
Of course, the VM engine must have a performance loss compared to Native.
Fortunately, Google tooks me to find this document:
https://istio.io/v1.8/docs/ops/deployment/performance-and-scalability/
One of the figures, gave me a hint:
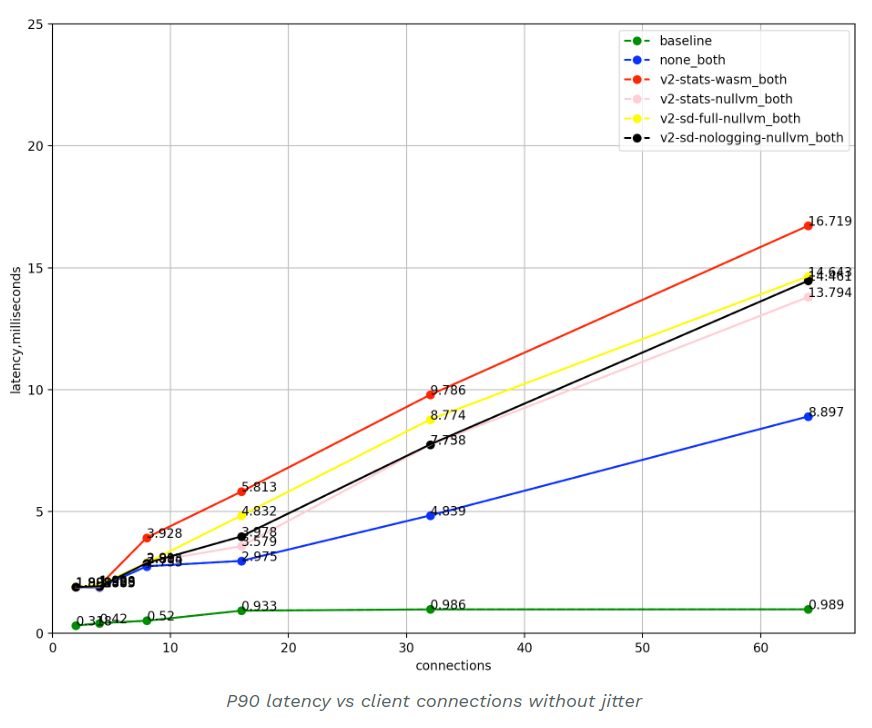
baselineClient pod directly calls the server pod, no sidecars are present.none_bothIstio proxy with no Istio specific filters configured.v2-stats-wasm_bothClient and server sidecars are present with telemetry v2v8configured.v2-stats-nullvm_bothClient and server sidecars are present with telemetry v2nullvmconfigured by default.v2-sd-full-nullvm_bothExport Stackdriver metrics, access logs and edges with telemetry v2nullvmconfigured.v2-sd-nologging-nullvm_bothSame as above, but does not export access logs.
For a performance test, what do it do with so many lines?
baselineWithout sidecarsnone_bothWithout Istio Filterv2-stats-wasm_bothWith WASM filterv2-stats-nullvm_bothWith Native Filter
What want to say in these few words? That is, we want to promote the use of WASM technology, so Envoy document WASM Filter as an built-in option. If you mind that 1ms delay, and then a little bit of CPU. Please use native technology. Well, I admit, I mind.
Note: I later found out that the official standard version of Istio 1.8 uses Native Filters. Our environment is an internal custom version that uses wasm Filter by default (or a utopia based on security, isolation, portability over performance). So, probably for you, Native Filter is already the default configuration.
Overloaded worker thread and the lazy CPU core
Below is the thread-level top monitoring of the Enovy process. Yes, pthread said, thread naming is not a patent of the Java world. The COMMAND column is the thread name.
top -p `pgrep envoy` -H -b

top - 01:13:52 up 42 days, 14:01,  0 users,  load average: 17.79, 14.09, 10.73
Threads:  28 total,   2 running,  26 sleeping,   0 stopped,   0 zombie
%Cpu(s): 42.0 us,  7.3 sy,  0.0 ni, 46.9 id,  0.0 wa,  0.0 hi,  3.7 si,  0.1 st
MiB Mem : 94629.32+total, 67159.44+free, 13834.21+used, 13635.66+buff/cache
MiB Swap:    0.000 total,    0.000 free,    0.000 used. 80094.03+avail Mem

   PID USER      PR  NI    VIRT    RES    SHR S  %CPU  %MEM     TIME+ COMMAND
    42 istio-p+  20   0  0.274t 221108  43012 R 60.47 0.228 174:48.28 wrk:worker_1
    41 istio-p+  20   0  0.274t 221108  43012 R 55.81 0.228 149:33.37 wrk:worker_0
    18 istio-p+  20   0  0.274t 221108  43012 S 0.332 0.228   2:22.48 envoy
At the same time, it was found that the increase in the concurrent pressure from the client did not significantly increase the CPU usage of the 2 worker threads envoy to 100%. The situation that hyper-threaded CPU cores cannot achieve core*2 performance has come. What to do? Try adding workers.
Tunning
Istio can customize Envoy Filter Chain with EnvoyFilter, so I try it:
|
|
|
|
Note: I later found out that the official standard version of Istio 1.8 uses Native Filters. Our environment is an internal custom version that uses wasm Filter by default (or a utopia based on security, isolation, portability over performance). So, probably for you, Native Filter is already the default configuration.
Below increase the number of worker threads of Envoy.
kubectl edit deployments.apps my-service-deployment

spec:
  template:
    metadata:
      annotations:
        proxy.istio.io/config: 'concurrency: 4'
Profile Sidecar CPU again
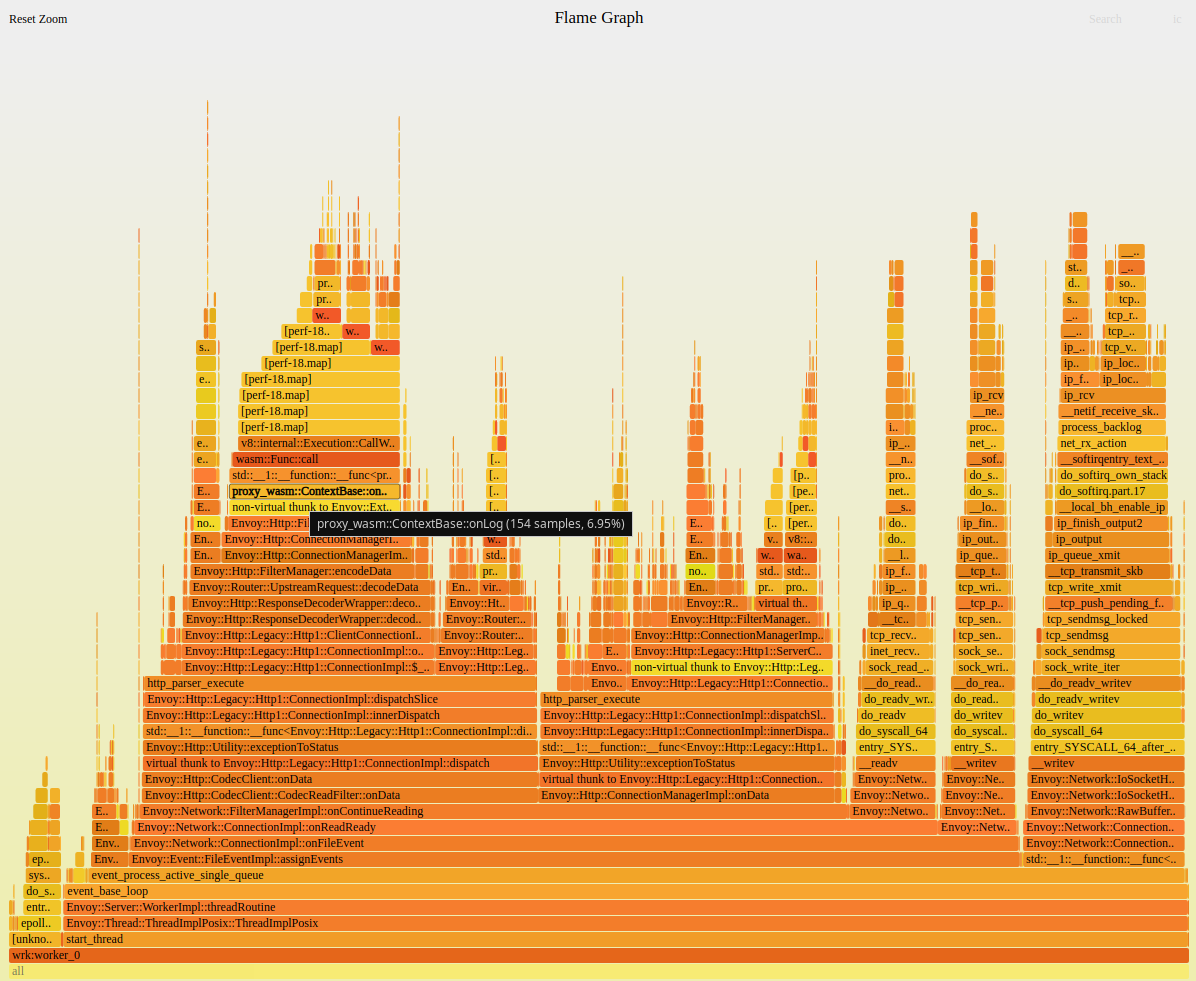
Since the native Envoy filter was used instead of the WASM filter. As you can see in the figure above, the stack symbol resolved failure is gone. Measured CPU usage decreased by approximately 8% and latency decreased by 1ms too.
Summary
Instead of condemning the WASM Envoy filter configuration and thread configuration, think about why you have to pay for several days to locate this problem. When we are very excited to sit on a new technology boat, in addition to remembering to bring a lifebuoy, we must not forget: you are the captain, in addition to sailing, you should understand the working principle and maintenance technology of the ship, in order to cope with the accident!