Please enable Javascript to view the contents

分析 Java 应用在 Istio 下的 warm up

 ·  ☕ 7 分钟

img

分析 Java 应用在 Istio 下的 warm up

故事的开始

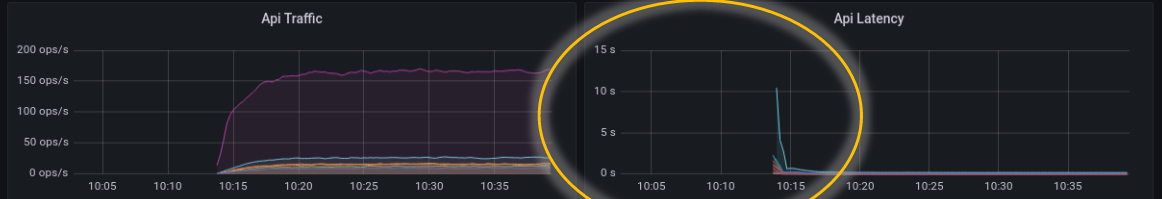
在很久很久前的,有个测试找到一个开发,说 k8s 下 HPA(自动伸缩) 新启动的 pod 的 api latency 特别高:

dashboard-high-latency-api

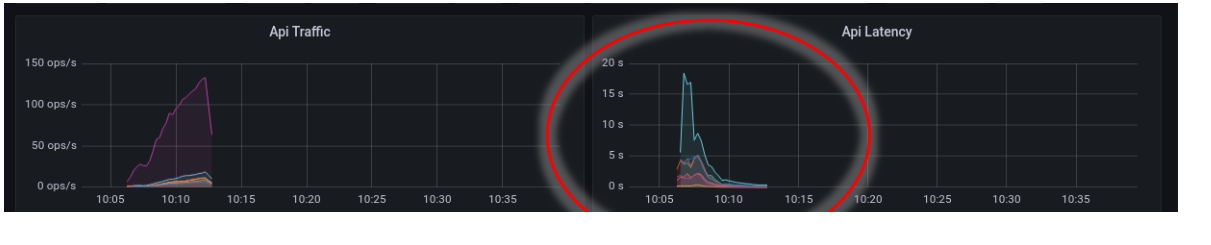
需要注意,上图是在 Java 服务提供者自身观察到的 latency,即观察点是服务的 server 端或说 upstream 。有同学会问,这个重要吗? api latency 就是 api latency 了,还要管是什么观察点的观察结果?

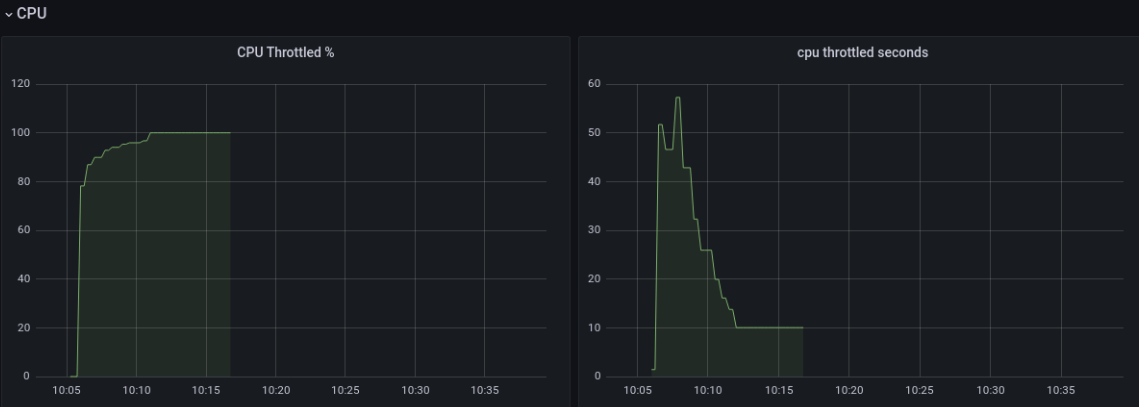
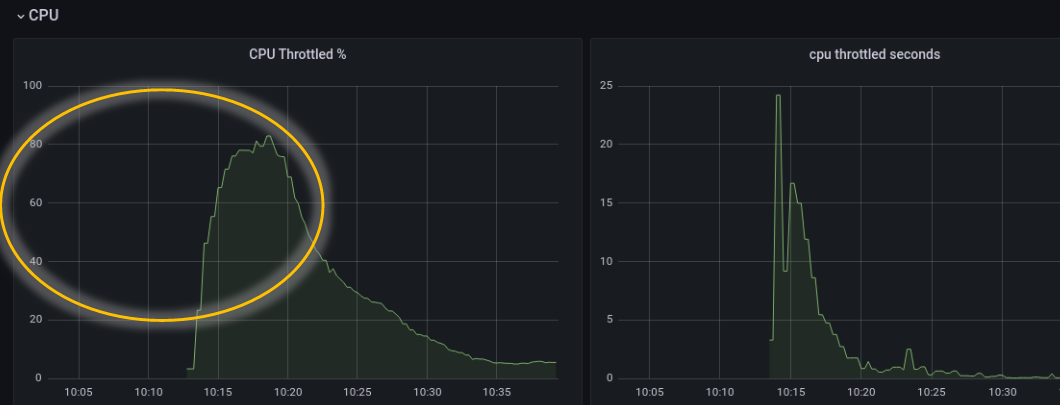
因为已知是 server 端的观察结果,那么就直接调查 server 端了。这次运气比较好,直接被告知 server 端 cpu 使用高。再看看 pod 配置:

1
2
3
4
5
6
7
        resources:
          limits:
            cpu: "2"
            memory: 4Gi
          requests:
            cpu: "2"
            memory: 4Gi

调查

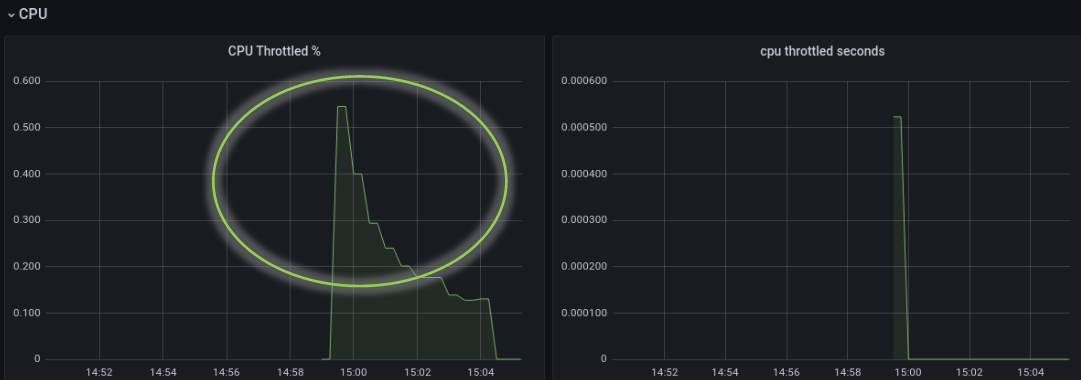
直觉告诉我,是 CPU 限流(CPU Throttled)了(这个直觉是两年前花了一个月在坑中爬出来后形成的,Grafana Dashboard 也是自己新手造的)。不幸言中:

dashboard-high-cpu-throttled.png

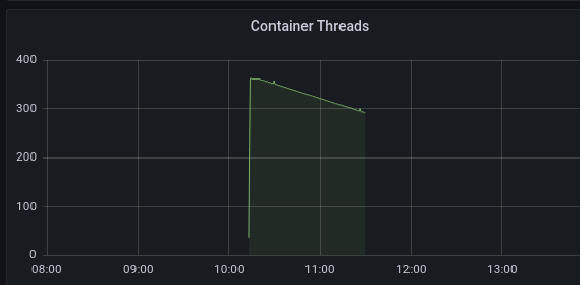
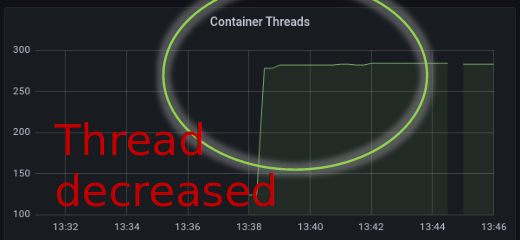
同时,注意到一个现象是,线程数在 pod 启动时,直线拉升:

dashboard-high-container-thread.png

好了,问题好像很简单,就看什么任务用了那么多 cpu ,有什么可以优化。

谁的锅

性能优化有个基本理论:

如果你不能拆解不可控的复杂问题可控的简单问题,那么这个优化只能看运气。

用 ps 拆解进程到线程是一个思路。看看 pod 启动期间的情况:

 1
 2
 3
 4
 5
 6
 7
 8
 9
10
11
12
13
14
15
16
17
18
19
20
21
22
23
24
25
26
27
28
29
export TZ='Asia/Shanghai' ;\
rm /tmp/top-thread-$POD_NAME.log ;\
while true ; do \
  k exec $POD_NAME -- bash -c 'ps --sort=-%cpu  -L -o tid,state,%cpu,cputimes,cputime,nice,pri,comm,maj_flt,psr,policy,wchan -p `pgrep --newest java` | (read -r; printf "%s\n" "$REPLY"; sort -k3rn -k4rn) | head -20 '  | awk '{ print strftime("%Y-%m-%d %H:%M:%S"), $0; fflush(); }' | tee -a /tmp/top-thread-$POD_NAME.log ;\
  sleep 5s ;\
done


2023-07-06 21:43:02     TID S %CPU     TIME     TIME  NI PRI COMMAND          MAJFL PSR POL WCHAN
2023-07-06 21:43:02  414573 R 39.2       50 00:00:50   0  19 C2 CompilerThre      1  26 TS  -
2023-07-06 21:43:02  414494 S 17.8       23 00:00:23   0  19 java                 9  36 TS  futex_wait_queue
2023-07-06 21:43:02  414574 R 14.8       19 00:00:19   0  19 C1 CompilerThre      3   2 TS  -
2023-07-06 21:43:02  415310 R  2.4        2 00:00:02   0  19 s0-io-0              0  63 TS  -
2023-07-06 21:43:02  415339 R  2.0        2 00:00:02   0  19 s0-io-3              0  65 TS  -
2023-07-06 21:43:02  415311 R  1.9        2 00:00:02   0  19 s0-io-1              0  63 TS  -
2023-07-06 21:43:02  415098 R  1.8        2 00:00:02   0  19 Thread-17            0  51 TS  -
2023-07-06 21:43:02  415808 S  1.7        1 00:00:01   0  19 qtp2063581529-8      0  15 TS  futex_wait_queue
2023-07-06 21:43:02  415901 S  1.7        1 00:00:01   0  19 qtp2063581529-1      0  72 TS  futex_wait_queue
2023-07-06 21:43:02  415893 S  1.6        1 00:00:01   0  19 qtp2063581529-1      0  10 TS  do_sys_poll
2023-07-06 21:43:02  414495 S  1.4        1 00:00:01   0  19 GC Thread#0          0  42 TS  futex_wait_queue
2023-07-06 21:43:02  414498 S  1.4        1 00:00:01   0  19 GC Thread#1          0   5 TS  futex_wait_queue
2023-07-06 21:43:02  415882 S  1.3        1 00:00:01   0  19 qtp2063581529-1      0  39 TS  do_sys_poll
2023-07-06 21:43:02  415768 S  1.2        1 00:00:01   0  19 qtp2063581529-7      0  60 TS  futex_wait_queue
2023-07-06 21:43:02  415109 R  1.1        1 00:00:01   0  19 Thread-18            1  53 TS  -
2023-07-06 21:43:02  415892 S  1.1        1 00:00:01   0  19 qtp2063581529-1      0  68 TS  futex_wait_queue
2023-07-06 21:43:02  415952 S  1.1        0 00:00:00   0  19 qtp2063581529-1      0  15 TS  futex_wait_queue
2023-07-06 21:43:02  416066 S  1.1        0 00:00:00   0  19 qtp2063581529-2      0  78 TS  futex_wait_queue
2023-07-06 21:43:02  415867 S  1.0        0 00:00:00   0  19 qtp2063581529-9      0   0 TS  futex_wait_queue
...

其中 qtp2063581529-... 就是负责处理 api 请求的线程。那么 C2 CompilerThre 是什么?当然就是 Compiler threads 了。地球人都知道,java 是 Just-In-Time (JIT) compiler 的,就是边跑边优化编译。JIT 这块我最近整理过一些笔记,见: 《Mark’s DevOps 雜碎》 - Java Compile

环境

Istio 1.17:

Open JDK 17

Tuning(调优) - Take 1

Compiler Tuning

本着谁的锅谁背的原则。让 Compiler 迟一点优化编译,避免在启动时与其它初始化任务争用有限的、容器限制的 2 cpus 。成熟的 Open JDK 17 当然已经提供相关参数了。让我们看看:

详细参考:《Mark’s DevOps 雜碎》 - Java Compiler Tuning

首先我们知道,默认情况下,JVM 是在应用运行过程中,根据代码的使用情况(可暂时简单视为代码被执行的次数),分期分级去优化编译的。每一级,都有每一级的准入门槛。
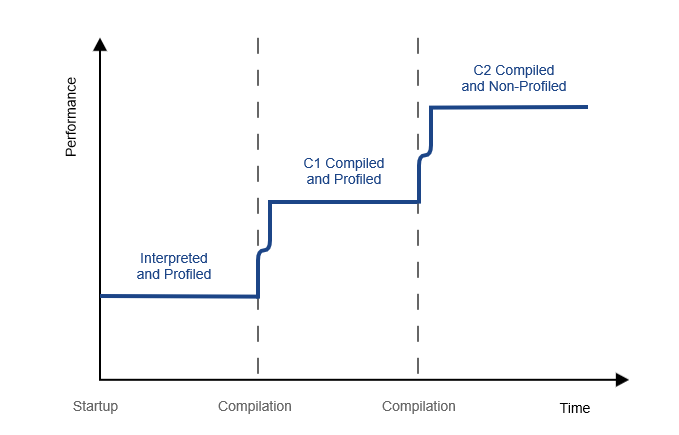
source: https://www.baeldung.com/jvm-tiered-compilation

Tier level(编译级别) Meaning
0 The code has been interpreted
1 Simple C1 compilation
2 Limited C1 compilation
3 Full C1 compilation
4 C2 compilation

JVM 提供了一堆参数可以调整几个编译层次的门槛,其默认值为:

 1
 2
 3
 4
 5
 6
 7
 8
 9
10
11
bash-4.4$ java -XX:+PrintFlagsFinal cp . Main  | grep -i Threshold
     intx CompileThreshold                         = 10000                                  {pd product} {default}
   double CompileThresholdScaling                  = 1.000000                                  {product} {default}
     intx Tier3BackEdgeThreshold                   = 60000                                     {product} {default}
     intx Tier3CompileThreshold                    = 2000                                      {product} {default}
     intx Tier3InvocationThreshold                 = 200                                       {product} {default}
     intx Tier3MinInvocationThreshold              = 100                                       {product} {default}
     intx Tier4BackEdgeThreshold                   = 40000                                     {product} {default}
     intx Tier4CompileThreshold                    = 15000                                     {product} {default}
     intx Tier4InvocationThreshold                 = 5000                                      {product} {default}
     intx Tier4MinInvocationThreshold              = 600                                       {product} {default}

我们的目标是推迟优化,所以就是加高门槛了。一个个参数调整有点麻烦,于是,Java 设计了一个总的门槛高度系数:-XX:CompileThresholdScaling

试着加大这个系数:

bash-4.4$ java -XX:+PrintFlagsFinal -XX:CompileThresholdScaling=1.5 -cp . Main | grep -i Threshold                                                                
     intx CompileThreshold                         = 15000                                  {pd product} {ergonomic}
   double CompileThresholdScaling                  = 1.500000                                  {product} {command line}
     intx Tier3BackEdgeThreshold                   = 90000                                     {product} {ergonomic}
     intx Tier3CompileThreshold                    = 3000                                      {product} {ergonomic}
     intx Tier3InvocationThreshold                 = 300                                       {product} {ergonomic}
     intx Tier3MinInvocationThreshold              = 150                                       {product} {ergonomic}
     intx Tier4BackEdgeThreshold                   = 60000                                     {product} {ergonomic}
     intx Tier4CompileThreshold                    = 22500                                     {product} {ergonomic}
     intx Tier4InvocationThreshold                 = 7500                                      {product} {ergonomic}
     intx Tier4MinInvocationThreshold              = 900                                       {product} 

Compiler threads 优先级

上面知道,编译由专门的 Compiler Thread 负责,编译线程的运行本身就和应用 api 处理线程争用本来就紧张的 CPU 资源。所以,还有一个思路是降低编译线程的调度优先级。Java 提供了一个参数 -XX:CompilerThreadPriority 可以去调整 Compiler Thread 优先级。需要注意的是,对于非 root 用户。-XX:CompilerThreadPriority=<n> 需要配合 -XX:ThreadPriorityPolicy=1 使用,方可生效。

 1
 2
 3
 4
 5
 6
 7
 8
 9
10
11
12
13
14
15
$ java -XX:CompilerThreadPriority=10 -XX:ThreadPriorityPolicy=1 -cp . Main

OpenJDK 64-Bit Server VM warning: -XX:ThreadPriorityPolicy=1 may require system level permission, e.g., being the root user. If the necessary permission is not possessed, changes to priority will be silently ignored.

$ ps --sort=-%cpu  -L -o tid,state,%cpu,cputimes,cputime,nice,pri,comm,maj_flt,psr,policy,wchan -p `pgrep --newest java` | (read -r; printf "%s\n" "$REPLY"; sort -k3rn -k4rn) | head -20 '  | awk '{ print strftime("%Y-%m-%d %H:%M:%S"), $0; fflush(); }

2023-07-06 21:43:02     TID S %CPU     TIME     TIME  NI PRI COMMAND          MAJFL PSR POL WCHAN
2023-07-06 21:43:02  414573 R 39.2       50 00:00:50   10 29 C2 CompilerThre      1  26 TS  -
2023-07-06 21:43:02  414494 S 17.8       23 00:00:23   0  19 java                 9  36 TS  futex_wait_queue
2023-07-06 21:43:02  414574 R 14.8       19 00:00:19   10 29 C1 CompilerThre      3   2 TS  -
2023-07-06 21:43:02  415310 R  2.4        2 00:00:02   0  19 s0-io-0              0  63 TS  -
2023-07-06 21:43:02  415339 R  2.0        2 00:00:02   0  19 s0-io-3              0  65 TS  -
2023-07-06 21:43:02  415311 R  1.9        2 00:00:02   0  19 s0-io-1              0  63 TS  -
2023-07-06 21:43:02  415098 R  1.8        2 00:00:02   0  19 Thread-17            0  51 TS  -
2023-07-06 21:43:02  415808 S  1.7        1 00:00:01   0  19 qtp2063581529-8      0  15 TS  futex_wait_queue

Linux 的线程优先级参数叫 Nice(NI),就是谦让系数的意思的。其实是数字越小,越优先。

详细参考:《Mark’s DevOps 雜碎》 - Java Compiler Tuning

Tuning - Take 1 结果

在 java 命令参数加上:

java -XX:CompilerThreadPriority=15 -XX:ThreadPriorityPolicy=1 -XX:CompileThresholdScaling=20

后,看看结果。

image-20230709141354492

image-20230709141507441

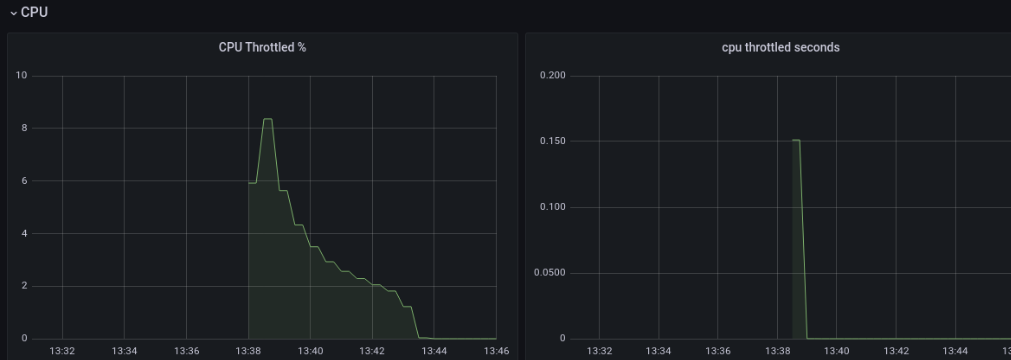
可见,调整参数以后,有相当的改善,虽然还是比较难看。这时如果查看编译线程用的 cpu ,会发现的确明显下降了:

$ ps --sort=-%cpu  -L -o tid,state,%cpu,cputimes,cputime,nice,pri,comm,maj_flt,psr,policy,wchan -p `pgrep --newest java` | (read -r; printf "%s\n" "$REPLY"; sort -k3rn -k4rn) | head -20 '  | awk '{ print strftime("%Y-%m-%d %H:%M:%S"), $0; fflush(); }

2023-07-06 22:43:02     TID S %CPU     TIME     TIME  NI PRI COMMAND          MAJFL PSR POL WCHAN
2023-07-06 22:43:02  414573 R 12.2       50 00:00:50   10 29 C2 CompilerThre      1  26 TS  -

Tuning - Take 2

各位应该还记得前面这图,线程数在 pod 启动时,直线拉升。

dashboard-high-container-thread.png

如果限制了容器只使用 2 cpus,但又给 java web server 的 thread pool 配置了比较大的 max threads。

想像一下,200 个并发 api 请求过来了。 java web server 开了 200 线程,他们之前并发争夺可怜的 2 cpus。就像 2022 年每天发生的事,200 个人去排队验 Hésuān 😷(什么,你居然忘记了?你幸福了)。不过这个比喻不太贴切,CPU 是分片调度线程的。但从 http 请求的角度看,大家都在等,CPU 也在忙,只是把每个 http 请求的任务,分成细小的时间片。然后中间“随意”插入其它 http 请求的时间片。总之,最后是每个 http 请求都不开心。最差的情况下, downstream client 已经 timeout 了,CPU 还在做已经无意义的工作。

不如引入准入和排队机制,这正是大师口中常吟诵的 “Overload control(过载保护)”。这就可以让已经入场的 http 请求在 timeout 前完成。而场外的 http 请求,要么是在内存(而非CPU)上排队(即等待线程池出现空闲线程),要么就分流去其它 Hésuān 检测点(其它已经完成 warm up 的老 POD)。

要实现这个思路,方法有很多,我先用最简单的 thread pool 线程池限制。减少 thread pool 大小,由 200 调整为 20 。

背压机制(Backpressure)

没有考虑 Backpressure 的 Overload control 不是好的 Overload control。我这里就是暂时未考虑了。Backpressure 在这个场景中,就是指在 web server 过载时,client 可以通过一些方法感知到,并在负载均衡算法中,减少这个有问题 web server 的流量权重。
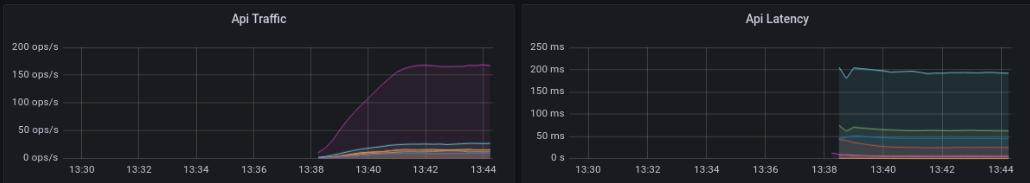
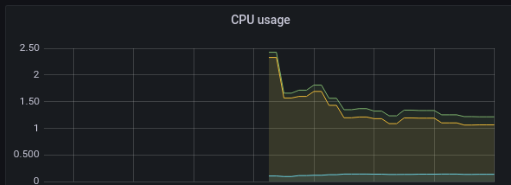
Tuning - Take 2 结果

image-20230709144958030

image-20230709145020569

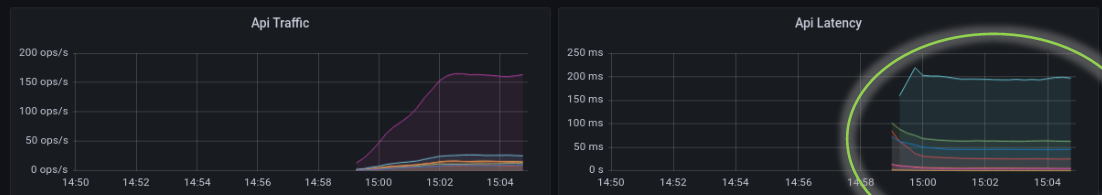
只看这个 Dashboard 的话,结果是优秀的。但如之前所说,请注意,这个观察点是 upstream http server 端。你有看看 downstream(client,在 Istio 场景下,就是和 http server 同一 pod 的 envoy istio-proxy sidecar) 的感受吗? Backpressure 做到位了吗?这个留给下回分解吧。

Tuning - Take 3

实在想不到,居然还有 take 3。话说,你应该也有类似的经验。老板或管理层总在说,你们这些基层员工,要有格局。那么,问题来了,什么是格局?

老板可能是这样想的:

做事有宽广的视线,不只看自己岗位的一亩三分地,全局看事情,以事件的结果效益去指导工作上的事,而不只是专才。

我作为基层码农的一份子,是这样想的:(注意,这样想不代表就这样认同,这里想法是事实,认同是立场,注意分清楚事实和立场)

客户在意的其实是成本和收益。你用的技术高低,有没什么技术情怀没什么关系。

举个例子,1k TPS,按这个应用的实现设计需要 20 个 cpu。你可以这样分 pod:

  • 10 pods,每个 2 cpus
  • 5 pods,每个 4 cpus

10 pods 和 5 pods 有区别吗?还真有。

10 pods 意味着同一个 java class。需要执行 10 次 JIT warm up,就是 10 次 JIT warm up 用的 cpu times。 而 5 pods 只需要大概一半。奇妙的是,一般客户不会在意你的每 pod cpu 数,只看总资源。

还有另外一种技术控可能可以接受的解释是:现代 jvm 在设计时,已经是为多 cpu 优化过的。2 CPU 下,会有各种后台线程争用 cpu ,最终增加业务线程 latency 的可能。如编译和 GC。

结果:

image-20230709152026095

image-20230709152141560

image-20230709152055068

image-20230709152119624

结语

技术或者有几个所谓的境界:

  1. 了解新名词,学习一些网上随手可得的科谱,做一些小项目,用这些名词刷亮自己的名片
  2. 了解这东西的实现机理甚至源码
  3. 灵活运用和定制
  4. 知道它是为何而来,将发展到哪儿去
  5. 什么都不懂
分享

Mark Zhu
作者
Mark Zhu
An old developer