https://iximiuz.com/en/posts/prometheus-metrics-labels-time-series/
What is a time series in Prometheus?

*Side note 1: Despite being born in the age of distributed systems, every Prometheus server node is autonomous. I.e., there is no distributed metric storage in the default Prometheus setup, and every node acts as a self-sufficient monitoring server with local metric storage. It simplifies a lot of things, including the following explanation, because we don’t need to think of how to merge overlapping series from different Prometheus nodes *😉
In general, a stream of timestamped values is called a time series. In the above example, there are four different time series. But only two metric names. I.e., a time series in Prometheus is defined by a combination of a metric name and a particular set of key-value labels.
Side note 2: Values are always floating-point numbers; timestamps are integers storing the number of milliseconds since the Unix epoch.
Every such time series is stored separately on the Prometheus node in the form of an append-only file. Since a series is defined by the label value(s), one needs to be careful with labels that might have high cardinality.
The terms time series, series, and metric are often used interchangeably. However, in Prometheus, a metric technically means a group of [time] series.
Downsides of active scraping
Since it’s a single node scraping multiple distributed endpoints with potentially different performance and network conditions, the exact sample timestamps will (although most of the time just slightly) vary for every scrape. Because of that and of the potential loss of some scrapes, the interval between two samples in a given time series is neither constant nor multiplication of the scrape interval. Remember the repercussions I mentioned above?
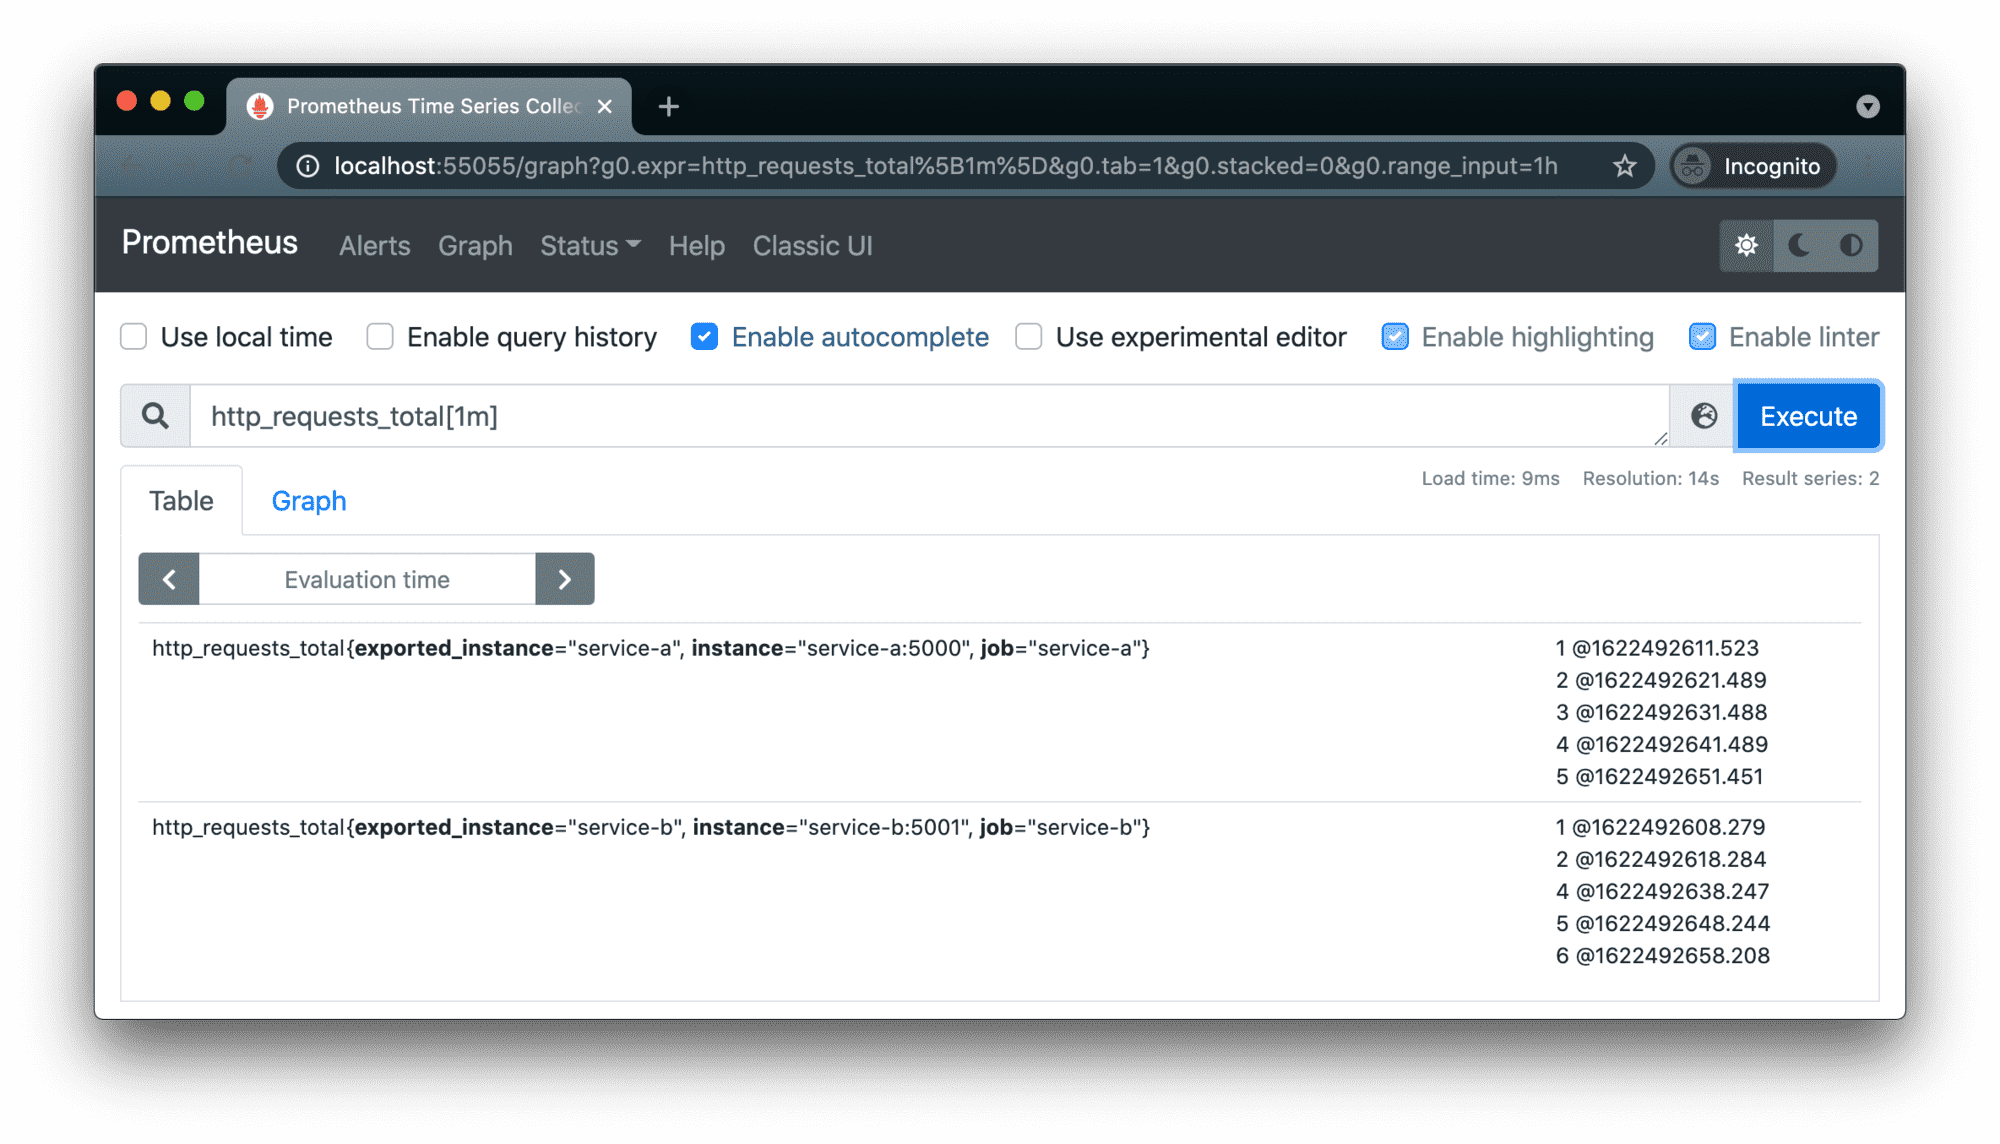
Prometheus node scraping two services every 10 seconds - actual samples aren’t ideally aligned in time.
There is another interesting, more important pitfall to be aware of. If a target reports a gauge (i.e., instant measurement) metric that changes more frequently than it’s scraped, the intermediate values will never be seen by the Prometheus node. Thus, it may cause blindness of the monitoring system to some bizarre patterns:
Obviously, counter (i.e., monotonically incrementing measurement) metrics don’t have such a problem.