
本文以 ebpf_exporter 持续跟踪内核 TCP/进程v行为为例,介绍一种基于轻量 eBPF+Prometheus+Trace 的定制系统底层观察和观察数据集成方法。
本文假设读者已经对 eBPF 理论有一些了解和使用(不一定是开发)。所以这里不会再写什么是 eBPF 、eBPF 如何强大之类推销内容了。如果你见到一个技术文章只说某一个技术的优点,没说缺点,然后拿着这个锤子去打所有见到的事物而不管那是不是个钉子,那么,take care.
缘起
后端服务遇到性能问题或奇怪的行为时,如果现有的监控指标不足以定位问题,SRE不得不运用个人经验提出一些猜想,而这些猜想大都指向基础架构。如网络丢包,kernel 某一类资源如文件或进程句抦池耗尽…。但要证明或证伪这些问题,都需要一个证人:kernel 。麻烦的地方是, kernel 和它的开发者有着一样的性格:多做事,少说话。大多数时候,这是个讨人喜欢的性格,直到异常情况发生时,它还是默默承受。
而 eBPF/BPF 的出现似乎改变了一切。eBPF 更像 kernel 的秘书。通过这个接口人,可以预约接收 kernel 事件,可以实现 微处觀 。而这种观察的视点(probe)又在 kernel 自身中,所以可以叫 觀自在 。利用这个特性,业界制作出许多功能全面的、强大的 eBPF 监控重器。但硬币的另一面是,强大功能背后的复杂性和不确定性也在增加。东西好用强大是重要,但维护成本和确定性也是关键。为什么?
云原生初期,大家觉得监控的指标越多越好。直到发现 Prometheus 爆盘/OOM,或服务发生基础平台问题需要跟踪定位时,才发觉那么多指标没有几个可以精确定位和证明问题。所以,按需 adhoc 抓取指标或事件的能力其实很重要。评价一个监控平台的一个要素是,可定制、可维护、复杂度可控。很多情况下我更倾向于简单 轻量 的软件。
ebpf-exporter 简介
ebpf_exporter 就是这样一个为 eBPF 监控小程序 提供支持的 eBPF小程序容器 。作为使用者或二次开发者,需要做的是:
- 用户选用 自带的 eBPF 监控小程序。或用 libbpf 写
eBPF 监控小程序 ,在内核 probe 中监听数据并写入 bpf map / ringbuff
- ebpf_exporter 负责加载和运行
eBPF 监控小程序
eBPF 监控小程序 负责从内核 probe 中监听事件和写入 bpf map / ringbuff- ebpf_exporter 负责在 user space 读取 bpf map / ringbuff 并对数据作一些
decode 和 聚合 工作,然后把数据交给 Prometheus / OpenTelemetry trace collector 。
示例
我不打算写如何使用 ebpf_exporter 了,因为官方文档已经写得比较好了。下面列举 3 个示例说明。
TCP Retransmit
网络质量,网络丢包问题定位,是 eBPF 的成名之作。而内核的 TCP 重传事件,是最直接的关键指标。
首先运行 tcp-retransmit eBPF 监控小程序
1
|
sudo ./ebpf_exporter --config.dir=examples --config.names=tcp-retransmit
|
开一个终端监控
1
|
watch "curl -v localhost:9435/metrics"
|
连接一个不响应的端口,触发 TCP 重传机制
一会后,之前的 watch 终端可见:
1
2
3
4
5
6
7
8
|
* Connection #0 to host localhost left intact
ebpf_exporter_decoder_errors_total{config="tcp-retransmit"} 0
ebpf_exporter_ebpf_program_info{config="tcp-retransmit",id="106",program="tcp_send_loss_probe",tag="539c53adb2e2fb74"} 1
ebpf_exporter_ebpf_program_info{config="tcp-retransmit",id="107",program="tcp_retransmit_skb",tag="2df86f386067020f"} 1
ebpf_exporter_enabled_configs{name="tcp-retransmit"} 1
# HELP ebpf_exporter_tcp_retransmit_ipv4_packets_total Total count of IPv4 TCP retransmissions
# TYPE ebpf_exporter_tcp_retransmit_ipv4_packets_total counter
ebpf_exporter_tcp_retransmit_ipv4_packets_total{local_ip="192.168.1.78",main_port="9999",peer_ip="1.1.1.63",type="retransmit"} 8
|
eBPF 小程序源码简析
首先是 ebpf_exporter user space 程序使用的配置文件:tcp-retransmit.yaml
 1
 2
 3
 4
 5
 6
 7
 8
 9
10
11
12
13
14
15
16
17
18
19
20
21
22
23
24
25
26
27
28
29
30
31
32
33
34
35
36
37
38
39
40
41
42
43
44
45
46
47
48
|
metrics:
  counters:
    - name: tcp_retransmit_ipv4_packets_total
      help: Total count of IPv4 TCP retransmissions
      labels:
        - name: local_ip
          size: 4
          decoders:
            - name: inet_ip
        - name: peer_ip
          size: 4
          decoders:
            - name: inet_ip
        - name: main_port
          size: 2
          decoders:
            - name: uint
        - name: type
          size: 2
          decoders:
            - name: uint
            - name: static_map
              static_map:
                1: retransmit
                2: tail_loss_probe
    - name: tcp_retransmit_ipv6_packets_total
      help: Total count of IPv6 TCP retransmissions
      labels:
        - name: local_ip
          size: 16
          decoders:
            - name: inet_ip
        - name: peer_ip
          size: 16
          decoders:
            - name: inet_ip
        - name: main_port
          size: 2
          decoders:
            - name: uint
        - name: type
          size: 2
          decoders:
            - name: uint
            - name: static_map
              static_map:
                1: retransmit
                2: tail_loss_probe
|
其中,可以看到:
- metric 的名字,如
tcp_retransmit_ipv4_packets_total
- 相关 label ,如
peer_ip
- 要读取的 bpf map ,如
retransmit
- bpf map 映射到 label 值的 decoder,如
inet_ip
kernel space BPF 源码在这里:tcp-retransmit.bpf.c
  1
  2
  3
  4
  5
  6
  7
  8
  9
 10
 11
 12
 13
 14
 15
 16
 17
 18
 19
 20
 21
 22
 23
 24
 25
 26
 27
 28
 29
 30
 31
 32
 33
 34
 35
 36
 37
 38
 39
 40
 41
 42
 43
 44
 45
 46
 47
 48
 49
 50
 51
 52
 53
 54
 55
 56
 57
 58
 59
 60
 61
 62
 63
 64
 65
 66
 67
 68
 69
 70
 71
 72
 73
 74
 75
 76
 77
 78
 79
 80
 81
 82
 83
 84
 85
 86
 87
 88
 89
 90
 91
 92
 93
 94
 95
 96
 97
 98
 99
100
101
102
103
104
105
106
107
108
109
110
111
112
|
#include <vmlinux.h>
#include <bpf/bpf_tracing.h>
#include "maps.bpf.h"

#define MAX_ENTRIES 8192

// Type of tcp retransmits
#define RETRANSMIT 1
#define TLP 2

#define AF_INET 2
#define AF_INET6 10

#define UPPER_PORT_BOUND 32768

struct ipv4_key_t {
    u32 saddr;
    u32 daddr;
    u16 main_port;
    u8 type;
};

struct ipv6_key_t {
    u8 saddr[16];
    u8 daddr[16];
    u16 main_port;
    u8 type;
};

struct {
    __uint(type, BPF_MAP_TYPE_LRU_HASH);
    __uint(max_entries, MAX_ENTRIES);
    __type(key, struct ipv4_key_t);
    __type(value, u64);
} tcp_retransmit_ipv4_packets_total SEC(".maps");

struct {
    __uint(type, BPF_MAP_TYPE_LRU_HASH);
    __uint(max_entries, MAX_ENTRIES);
    __type(key, struct ipv6_key_t);
    __type(value, u64);
} tcp_retransmit_ipv6_packets_total SEC(".maps");

static int extract_main_port(const struct sock *sk)
{
    u16 sport = sk->__sk_common.skc_num;
    u16 dport = __builtin_bswap16(sk->__sk_common.skc_dport);

    if (sport > UPPER_PORT_BOUND && dport > UPPER_PORT_BOUND) {
        return 0;
    }

    if (sport < dport) {
        return sport;
    }

    return dport;
}

#define TRACE_PROTOCOL(key_type, map, ip_extractor)                                                                    \
    key_type key = {};                                                                                                 \
                                                                                                                       \
    key.type = type;                                                                                                   \
    key.main_port = extract_main_port(sk);                                                                             \
                                                                                                                       \
    ip_extractor;                                                                                                      \
                                                                                                                       \
    increment_map(map, &key, 1);                                                                                       \
                                                                                                                       \
    return 0;

static int trace_ipv4(const struct sock *sk, u8 type)
{
    TRACE_PROTOCOL(struct ipv4_key_t, &tcp_retransmit_ipv4_packets_total, {
        key.saddr = sk->__sk_common.skc_rcv_saddr;
        key.daddr = sk->__sk_common.skc_daddr;
    });
}

static int trace_ipv6(const struct sock *sk, u8 type)
{
    TRACE_PROTOCOL(struct ipv6_key_t, &tcp_retransmit_ipv6_packets_total, {
        bpf_probe_read_kernel(&key.saddr, sizeof(key.saddr), sk->__sk_common.skc_v6_rcv_saddr.in6_u.u6_addr32);
        bpf_probe_read_kernel(&key.daddr, sizeof(key.daddr), sk->__sk_common.skc_v6_daddr.in6_u.u6_addr32);
    });
}

static int trace_event(const struct sock *sk, u8 type)
{
    switch (sk->__sk_common.skc_family) {
    case AF_INET:
        return trace_ipv4(sk, type);
    case AF_INET6:
        return trace_ipv6(sk, type);
    }

    return 0;
}

SEC("fentry/tcp_send_loss_probe")
int BPF_PROG(tcp_send_loss_probe, struct sock *sk)
{
    return trace_event(sk, TLP);
}

SEC("fentry/tcp_retransmit_skb")
int BPF_PROG(tcp_retransmit_skb, struct sock *sk)
{
    return trace_event(sk, RETRANSMIT);
}

char LICENSE[] SEC("license") = "GPL";
|
可见,是基于 libbpf 框架。是使用了 fentry 类型的 probe 去捕获 tcp_retransmit 事件。如果你对写 libbpf 程序有兴趣,可见我之前写的相关文章:《BPF 系统接口 与 libbpf 示例分析 - eBPF基础知识 Part2》 。不过说实话,我写得有点乱。
Socket Accept Latency
对于网络服务类型的应用,socket accept latency 是一个关键的 latency 性能指标。对于 tcp 服务,从 kernel 完成三次握手,到应用 accept 这个连接的 latency 如果太大,就很能说明相关环节有问题,如 CPU 限流,线程调度不均、线程在其它地方 block 住了。
1
|
sudo ./ebpf_exporter --config.dir=examples --config.names=accept-latency
|
触发事件:
 1
 2
 3
 4
 5
 6
 7
 8
 9
10
11
|
# 运行 TCP 服务进程
$ nc -l -k 8080
# 按下 Ctrl+z 挂起服务端进程
^Z
[1]  + 426668 suspended  nc -l 8080
# 运行客户端,完成三次握手
$ nc localhost 8080 &
# 等待 10s
$ sleep 10s
# 继续服务端进程
$ fg
|
源码分析不做了,源码可见于:
https://github.com/cloudflare/ebpf_exporter/tree/master/examples
进程树和生命周期跟踪
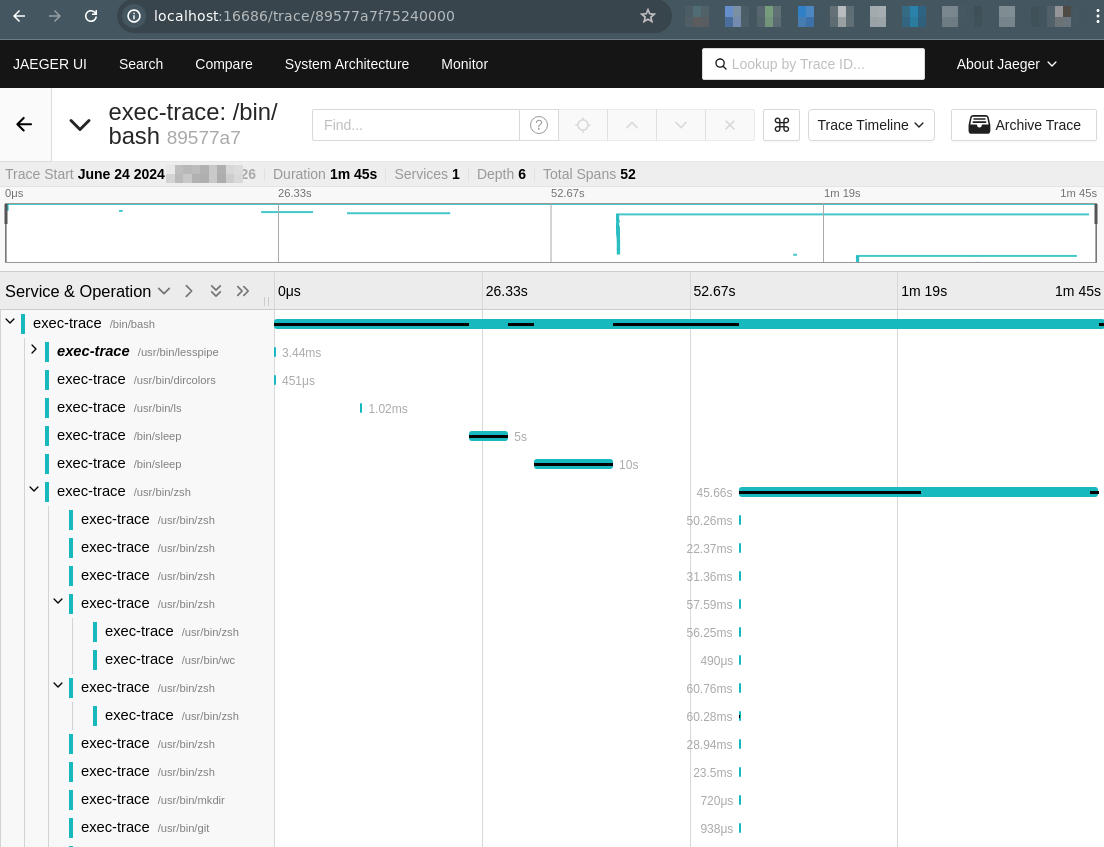
这是我觉得最有用和最有趣的 ebpf_exporter 内置 trace 。它可以跟踪所有 /bin/bash 开启的子进程,孙进程……
年经的读者或者会好奇,这东西有什么鬼用? 如果你要调查一个陌生应用的行为,知道他的命令行和进程行为是个快速的方法。还有,有时应用会高频启动进程,也可以通过这个做 troubleshooting 。
1
|
sudo OTEL_EXPORTER_OTLP_ENDPOINT=http://localhost:4318 ./ebpf_exporter --debug --config.dir=examples --config.names=exec-trace
|
使用前,需要运行一个 OpenTelemetry trace collector,我用了 all-in-one Jager。ebpf-exporter 的官方说明文档在这里。
触发事件:
➜ /bin/bash
$ ls
 bin ...
$ /bin/sleep 5s
$ /bin/sleep 10s
$ zsh
➜ /bin/echo "i am zsh"
i am zsh
➜ /bin/bash
$ /bin/echo "i am bash"
i am bash
$ exit
➜ exit
源码分析不做了,源码可见于:
https://github.com/cloudflare/ebpf_exporter/tree/master/examples
k8s 中运行
ebpf_exporter 在 k8s 中运行是比较不 native 的,因为没有针对 k8s 的 decoder 。其实要自己用 golang 编写也是很容易的。如,可以把用 golang 写个 decoder ,访问 k8s API,把 cgroup id 映射加 k8d pod/container 名称。
我实验环境是在 k3s 中以 DaemonSet 方式运行:
  1
  2
  3
  4
  5
  6
  7
  8
  9
 10
 11
 12
 13
 14
 15
 16
 17
 18
 19
 20
 21
 22
 23
 24
 25
 26
 27
 28
 29
 30
 31
 32
 33
 34
 35
 36
 37
 38
 39
 40
 41
 42
 43
 44
 45
 46
 47
 48
 49
 50
 51
 52
 53
 54
 55
 56
 57
 58
 59
 60
 61
 62
 63
 64
 65
 66
 67
 68
 69
 70
 71
 72
 73
 74
 75
 76
 77
 78
 79
 80
 81
 82
 83
 84
 85
 86
 87
 88
 89
 90
 91
 92
 93
 94
 95
 96
 97
 98
 99
100
101
102
103
104
105
|
cat <<"EOF" | kubectl apply -f -

apiVersion: v1
kind: ServiceAccount
metadata:
  name: ebpf-exporter
  namespace: monitoring

EOF

####

cat <<"EOF" | kubectl apply -f -

apiVersion: apps/v1
kind: DaemonSet
metadata:
  name: ebpf-exporter
  namespace: monitoring
spec:
  selector:
    matchLabels:
      app.kubernetes.io/name: ebpf-exporter
  template:
    metadata:
      labels:
        app.kubernetes.io/name: ebpf-exporter
    spec:
      automountServiceAccountToken: true
      serviceAccountName: ebpf-exporter
      containers:
        - name: ebpf-exporter
          command:
          - /ebpf_exporter
          args:
          - --config.dir
          - /examples/
          - --web.listen-address
          - 0.0.0.0:9435
          - --config.names
          - timers,uprobe,usdt,shrinklat,biolatency,accept-latency,bpf-jit,cachestat,cgroup,llcstat,raw-tracepoints,tcp-syn-backlog,tcp-window-clamps,exec-trace,sock-trace
          image: ghcr.io/cloudflare/ebpf_exporter:v2.4.2
          env:
          - name: OTEL_EXPORTER_OTLP_ENDPOINT
            value: http://jaeger:4318
          ports:
          - name: metrics
            containerPort: 9435
            protocol: TCP
          volumeMounts:
          - mountPath: /sys/kernel/debug
            name: kernel
          - mountPath: /lib/modules/
            name: modules
          - mountPath: /sys/fs/cgroup
            name: cgroup
          - mountPath: /sys/kernel/btf
            name: btf
          securityContext:
            privileged: true
      dnsPolicy: ClusterFirst
      restartPolicy: Always
      schedulerName: default-scheduler
      volumes:
      - hostPath:
          path: /sys/kernel/debug
          type: Directory
        name: kernel
      - hostPath:
          path: /lib/modules/
          type: Directory
        name: modules
      - hostPath:
          path: /sys/fs/cgroup
          type: Directory
        name: cgroup
      - hostPath:
          path: /sys/kernel/btf
          type: Directory
        name: btf

EOF


####

cat <<"EOF" | kubectl apply -f -

apiVersion: v1
kind: Service
metadata:
  name: ebpf-exporter
  labels:
    app.kubernetes.io/name: ebpf-exporter
  namespace: monitoring
spec:
  type: LoadBalancer
  ports:
  - port: 9435
    protocol: TCP
    targetPort: metrics
  selector:
    app.kubernetes.io/name: ebpf-exporter

EOF
|
然后 Prometheus 端这样配置:
 1
 2
 3
 4
 5
 6
 7
 8
 9
10
11
12
|
apiVersion: v1
kind: ConfigMap
metadata:
  name: prometheus-config
  namespace: monitoring
data:
  prometheus.yml: |
    scrape_configs:
      - job_name: 'ebpf_node'
        static_configs:
        - targets: ['ebpf-exporter:9435']
EOF
|
结语
本文不是一个手把手的教程,只是希望对读者有点启发罢了。Happy hacking BPF & Kernel !
在乌托邦世界里,一切的人和物,都能做到观照内心,自得其乐。而对于苦苦生存于现世的无力改变世界的小我,或能做到的就是觀自在,度一切心中苦厄。
觀自在菩薩, 行深般若波羅密多時, 照見五蘊皆空, 度一切苦厄。
—— प्रज्ञापारमिताहृदय 唐·玄奘(649年译)